Next: Conclusions
Up: M. Clapp: Velocity sensitivity
Previous: Theory
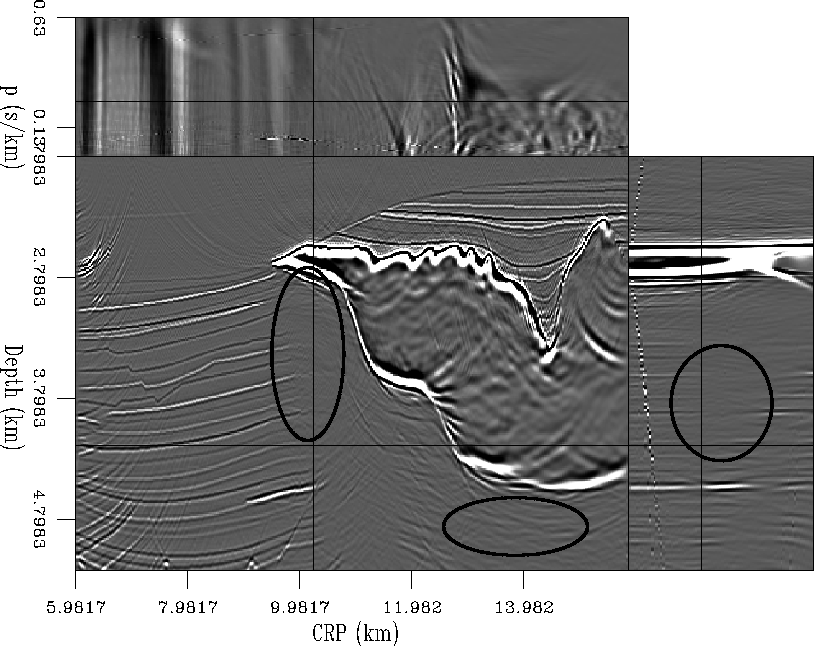
I applied the downward continuation migration and the preconditioned
inversion scheme to a synthetic dataset provided to us by SMAART JV,
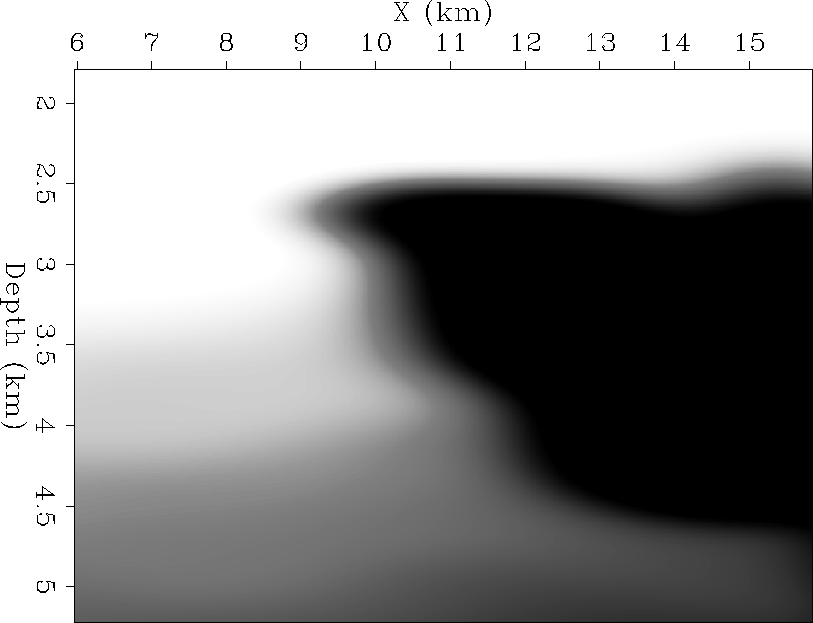
using different velocity models. The correct velocity model can be seen
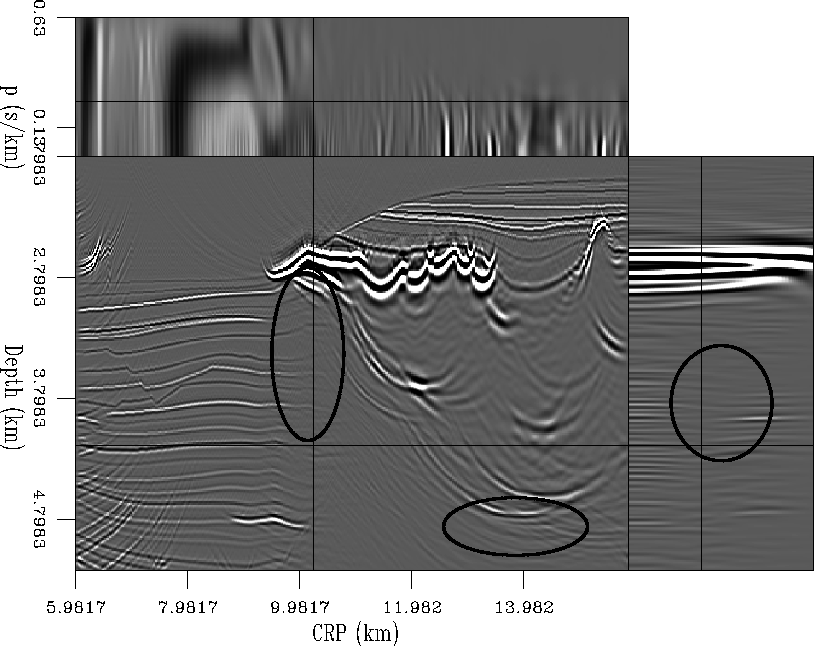
in Figure ![[*]](http://sepwww.stanford.edu/latex2html/cross_ref_motif.gif) . The result of migration using this model
is Figure . In the CRP-depth panel, note the sudden
decrease in amplitude of the reflectors as they pass beneath the salt
edge, particularly within the oval. There are also strong artifacts in the
shadow zone beneath the salt (inside the oval)
which make it difficult to pick out any true events. In the ph-depth
panel, note the ``holes'' in the events at the mid-range of
ray parameters (inside the oval). These holes are caused by the poor
illumination under the
salt edge. The steeply dipping events in the ph-depth
panel are artifacts caused by aliasing along the offset axis in Fourier space.
. The result of migration using this model
is Figure . In the CRP-depth panel, note the sudden
decrease in amplitude of the reflectors as they pass beneath the salt
edge, particularly within the oval. There are also strong artifacts in the
shadow zone beneath the salt (inside the oval)
which make it difficult to pick out any true events. In the ph-depth
panel, note the ``holes'' in the events at the mid-range of
ray parameters (inside the oval). These holes are caused by the poor
illumination under the
salt edge. The steeply dipping events in the ph-depth
panel are artifacts caused by aliasing along the offset axis in Fourier space.


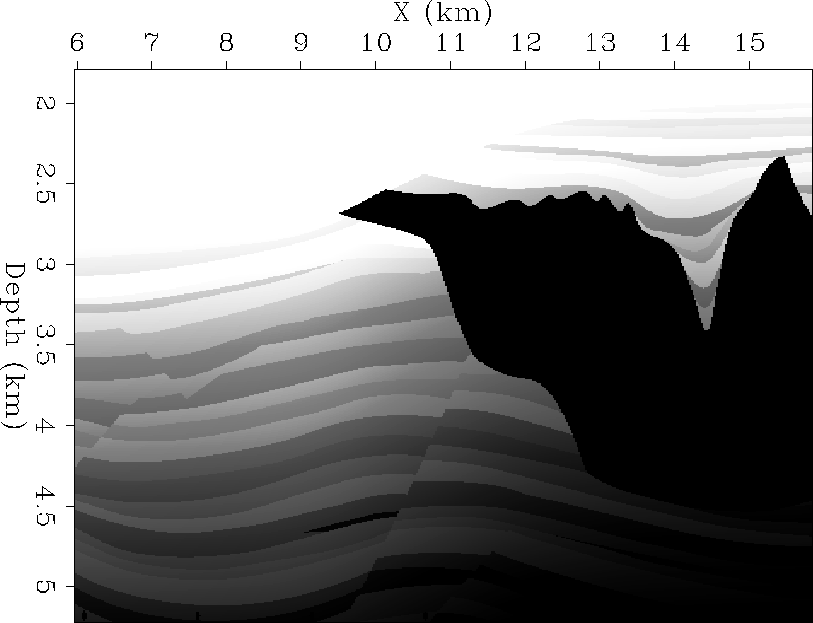
 mig.corvel
Figure 2 The result of downward continuation migration
using the correct velocity model. Note the low amplitudes of events as they
pass beneath the salt in the CRP-depth panel and the artifacts obscuring
events beneath the salt (indicated by ovals). In the offset ray
parameter-depth panel note the
holes in the events at the mid-range of offset ray parameters (particularly
within the oval).
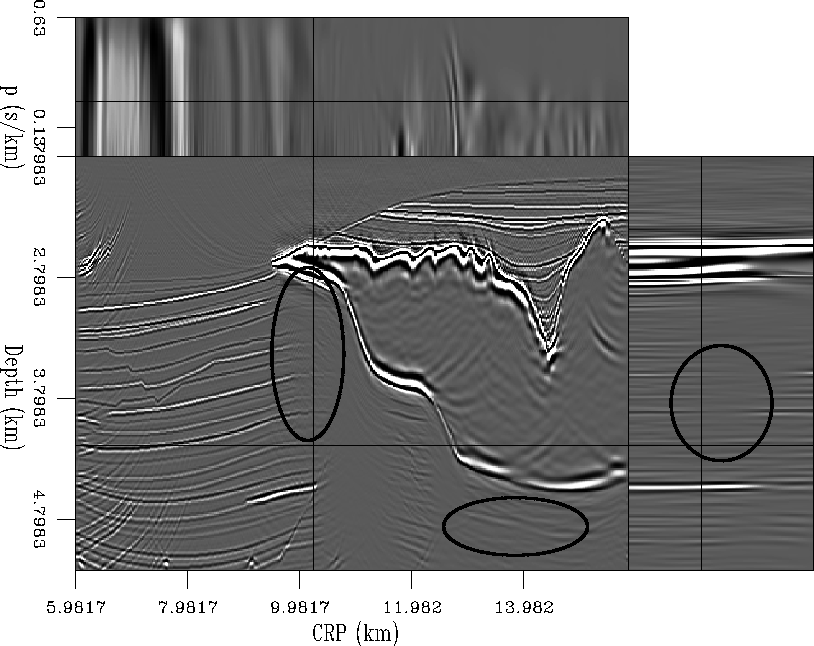
The result of 3 iterations of conjugate-gradient preconditioned
least-squares inversion using the correct velocity model can be seen in
Figure . Note that the artifacts have been largely
cleaned up. It is now possible to reliably pick out events beneath the
salt (see inside the oval). In the CRP-depth panel, the amplitude of the
events is maintained farther beneath the salt (particularly within the oval).
The holes in the ph-depth panel (inside the oval) are being filled in.
geop.corvel
Figure 3 The result of 3 iterations of preconditioned
inversion using the correct velocity model. Note the more consistent
amplitudes of events as they pass beneath the salt in the CRP-depth panel
and the lack of artifacts obscuring
events beneath the salt (inside ovals). In the offset ray parameter-depth
panel note the
filling in of the holes in the events at the mid-range of offset ray
parameters (inside ovals).
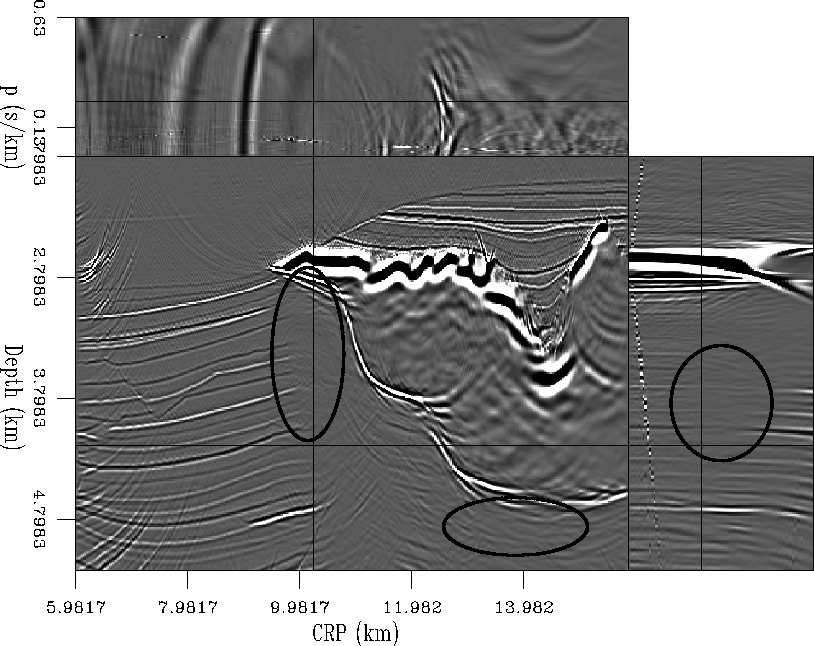
To test the sensitivity of the preconditioned inversion, the first
incorrect velocity model I tested simply increased the correct
velocities by  . As expected, the migration result using this velocity
model (Figure ) shows the events positioned deeper
than they should be and moveout along the offset ray parameter
axis. The ovals on this figure are placed in the same absolute positions
as the the ovals in Figures and ,
not relative to the events themselves.
. As expected, the migration result using this velocity
model (Figure ) shows the events positioned deeper
than they should be and moveout along the offset ray parameter
axis. The ovals on this figure are placed in the same absolute positions
as the the ovals in Figures and ,
not relative to the events themselves.
mig.hivel
Figure 4 The result of downward continuation migration
using a velocity model higher than the correct model. The events are
all positioned deeper than they should be and there is
moveout along the offset ray parameter axis. The ovals still indicate the
loss of amplitudes under the salt edge and the poor imaging beneath the
salt in the CRP-depth panel and holes in the events in the ph panel.
Recall that the preconditioning operator acts horizontally along the
offset ray parameter axis. It is this sensitivity that we are interested
in observing in the result of 3 iterations of preconditioned inversion
using the high velocity model (Figure ). Note
that once again the preconditioned inversion has cleaned up many of the
artifacts. In the CRP-depth panel, the events extend farther under the
salt, in a similar way to the inversion result using the correct velocity
(Figure ). The more interesting result is the
ph-depth panel. The inversion is still successfully filling in the
holes along the events at the mid-range of offset ray parameters. At
large ph, where the moveout is more pronounced, the preconditioning
has made some attempt to change the dips to be more horizontal, but the
moveout is still visible. This means that this result is most likely
not safe to use for velocity analysis, but this preconditioned inversion
technique was never intended as a velocity tool. Overall, this result
indicates that this technique can produce a better image than migration
alone, even when the velocity model is incorrect by up to .
geop.hivel
Figure 5 The result of 3 iterations of preconditioned
inversion using the too high velocity model. Despite the use of the
incorrect velocity model, the image is quite comparable to the result using
the correct velocity (Figure ). In the CRP-depth panel,
the events extend farther under the salt and events under the salt can be
seen (inside the ovals). In the ph-depth panel, the
holes in the events are filled in (inside the oval).
vel.smoothvel
Figure 6 The smoothed velocity model. Note
that the canyon in the top of the salt has disappeared.
|
|  |
A more extreme velocity model I tested was a severely smoothed one
(Figure ). This model has been smoothed so
much that the canyon in the top of the salt has disappeared. As
expected, the migration result from this model isn't very good
(Figure ). The depth positioning of events
is fairly good away from the salt, but becomes poor near the salt.
The salt top and bottom are very poorly imaged. The events in the
ph-depth panel appear to be mostly random. Once again, the ovals
indicate the same absolute regions as the ovals in
Figures and .
mig.smoothvel
Figure 7 The result of downward continuation migration
using a severely smoothed velocity model. The events in the CRP-depth
panel are properly imaged away from the salt but are mispositioned near
the salt. The offset ray parameter-depth panel is completely
uninformative. The ovals
indicate the same absolute regions as the ovals in
Figures and .
The result of 3 iterations of preconditioned inversion using this smoothed
velocity model can be seen in Figure . Although
many of the artifacts have been cleaned up, overall the image is not
any better than the migration result. The events in the ph-depth
panel are more horizontal, but they are not more believable than the events
in the ph-depth of the migration result. This is a reassuring result,
as it indicates that the regularization was not able to artificially
introduce events where the data indicated otherwise.
geop.smoothvel
Figure 8 The result of 3 iterations of preconditioned
inversion using the smoothed velocity model. The result is cleaner than
the migration result, but not more believable. The ovals
indicate the same absolute regions as the ovals in
Figures and
Next: Conclusions
Up: M. Clapp: Velocity sensitivity
Previous: Theory
Stanford Exploration Project
10/14/2003