


In Fig. 2,
we compare the prediction of Johnson (2001) for KU to our
own for a consolidated sandstone (frame properties as determined in
the Appendix with k=100 mD, c=10, ![]() ) in which phase 1
is saturated with water and phase 2 is taken to be spherical regions
saturated with air. The two estimates have identical asymptotic
dependence in both the limits of high and low frequencies. In the
cross-over range, the physics is not precisely modeled in either
approach. However, even in the cross-over range, the differences
in the two models is slight.
) in which phase 1
is saturated with water and phase 2 is taken to be spherical regions
saturated with air. The two estimates have identical asymptotic
dependence in both the limits of high and low frequencies. In the
cross-over range, the physics is not precisely modeled in either
approach. However, even in the cross-over range, the differences
in the two models is slight.
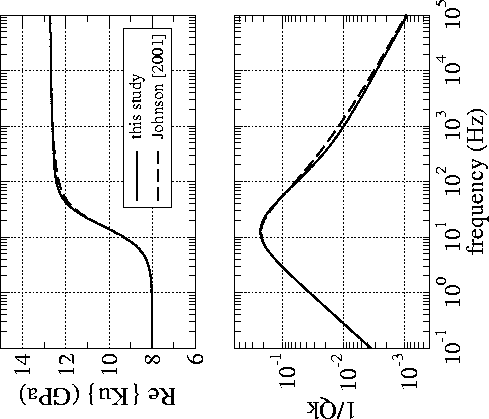 |

Figure 3
gives the P-velocity and attenuation for
a model in which the frame properties correspond to
k=10 mD, c=15, and ![]() . Phase 2 is saturated by air and is taken to
be isolated spheres of radius a=1 cm. Phase 1 is saturated with water.
The volume fraction v2 occupied
by these 1 cm spheres of gas is as shown in the figure. Even tiny amounts of
gas saturation yields rather large amounts of attenuation and dispersion.
. Phase 2 is saturated by air and is taken to
be isolated spheres of radius a=1 cm. Phase 1 is saturated with water.
The volume fraction v2 occupied
by these 1 cm spheres of gas is as shown in the figure. Even tiny amounts of
gas saturation yields rather large amounts of attenuation and dispersion.
 |