

Next: Real data
Up: Experiments
Previous: Experiments
We use the same data panels as Guitton and Symes (1999) to
compare the results of BP to Huber norm results as they are both l1
minimization strategies.
![[*]](http://sepwww.stanford.edu/latex2html/foot_motif.gif) Synthetic tests are designed evaluate the
method's performance to invert the HRT
under circumstances of missing data, a slow plane wave superimposed on
hyperbolic events, and spiky data space noise. Two field CMP's are
also analyzed and compared to the Huber norm result. The
dissimilarities in axes origin and formating of the plots are
unimportant. The spikes are at the correct values, and the important
thing to note in the plots is the distribution of energy around the
model space. The HRT operator used for this implementation has no AVO
qualities, although the synthetics were modeled with a wavelet and
amplitude variation.
Synthetic tests are designed evaluate the
method's performance to invert the HRT
under circumstances of missing data, a slow plane wave superimposed on
hyperbolic events, and spiky data space noise. Two field CMP's are
also analyzed and compared to the Huber norm result. The
dissimilarities in axes origin and formating of the plots are
unimportant. The spikes are at the correct values, and the important
thing to note in the plots is the distribution of energy around the
model space. The HRT operator used for this implementation has no AVO
qualities, although the synthetics were modeled with a wavelet and
amplitude variation.
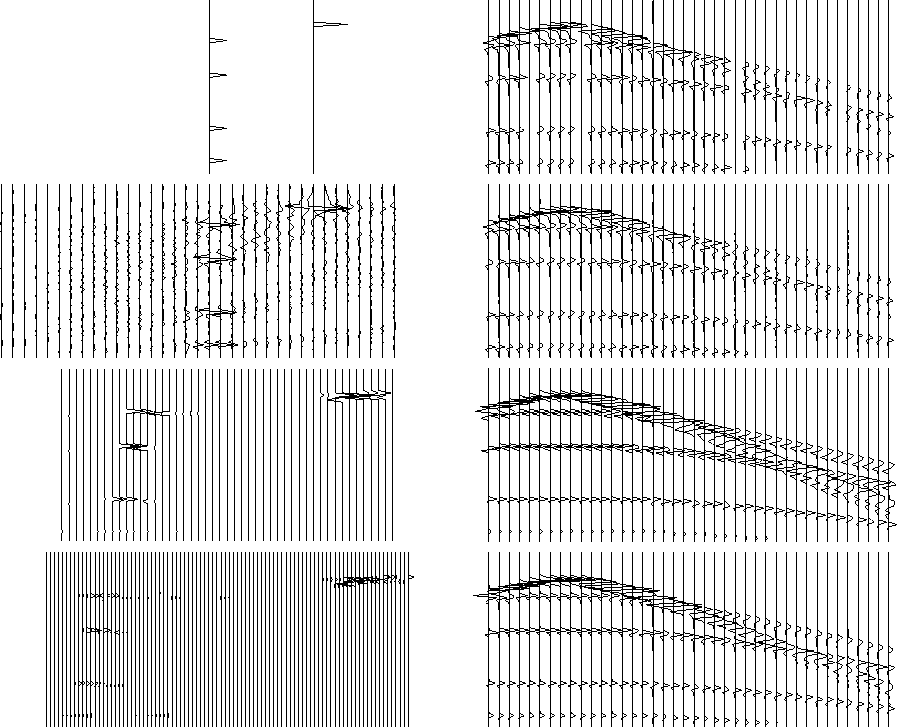
Figure ![[*]](http://sepwww.stanford.edu/latex2html/cross_ref_motif.gif) shows the results of the BP method when
addressing the problem of missing data. We can see that the predicted
data looks as accurate as the Huber norm result. The velocity model
space, however, shows considerable difference. Notice the resolution
increase over the same range of velocities and the lack of appreciable
chatter away from basis atoms. With this figure, and those to come
dealing with the synthetic examples, the predicted data looses the
wavelet character and the amplitude seems to diminish with depth.
shows the results of the BP method when
addressing the problem of missing data. We can see that the predicted
data looks as accurate as the Huber norm result. The velocity model
space, however, shows considerable difference. Notice the resolution
increase over the same range of velocities and the lack of appreciable
chatter away from basis atoms. With this figure, and those to come
dealing with the synthetic examples, the predicted data looses the
wavelet character and the amplitude seems to diminish with depth.
miss
Figure 1 Missing data. Left column is velocity
model space. Right column is data space. Row 1 is input velocity
and modeled data. Row 2 is Huber norm inversion and modeled
data. Row 3 and 4 are BP inversion and predicted data results. Row
3 model space has approximately the same number of model
variable as data points. Row 4 has four times the number of model
variables.

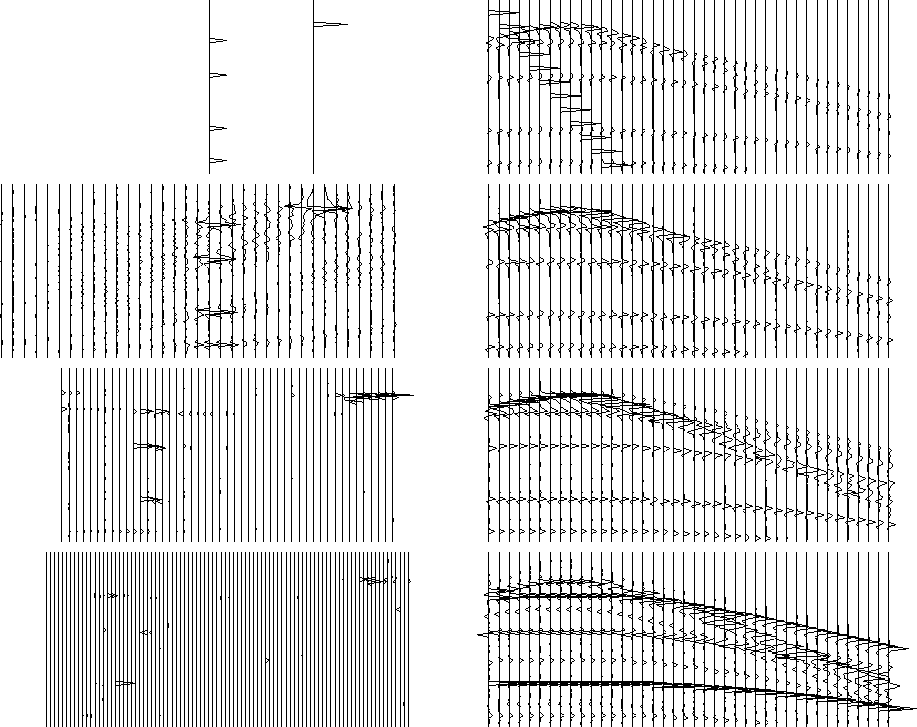
Figure ![[*]](http://sepwww.stanford.edu/latex2html/cross_ref_motif.gif) shows the results of the BP method when
a slow plane wave is superimposed on the data. The overcomplete
dictionary now shows significantly less chatter about the velocity
panel, and very distinguishable differences in the predicted data
panel are emerging on the right side of the CMP where the events
cross. Combination operators, linear and hyperbolic hybrid operators
Trad et al. (2001), may be ideal for this situation, but have not been
tried exhaustively yet.
shows the results of the BP method when
a slow plane wave is superimposed on the data. The overcomplete
dictionary now shows significantly less chatter about the velocity
panel, and very distinguishable differences in the predicted data
panel are emerging on the right side of the CMP where the events
cross. Combination operators, linear and hyperbolic hybrid operators
Trad et al. (2001), may be ideal for this situation, but have not been
tried exhaustively yet.
surf
Figure 2 Slow plane wave
superposition. Same format as explained in the caption of Figure
![[*]](http://sepwww.stanford.edu/latex2html/cross_ref_motif.gif) .
.

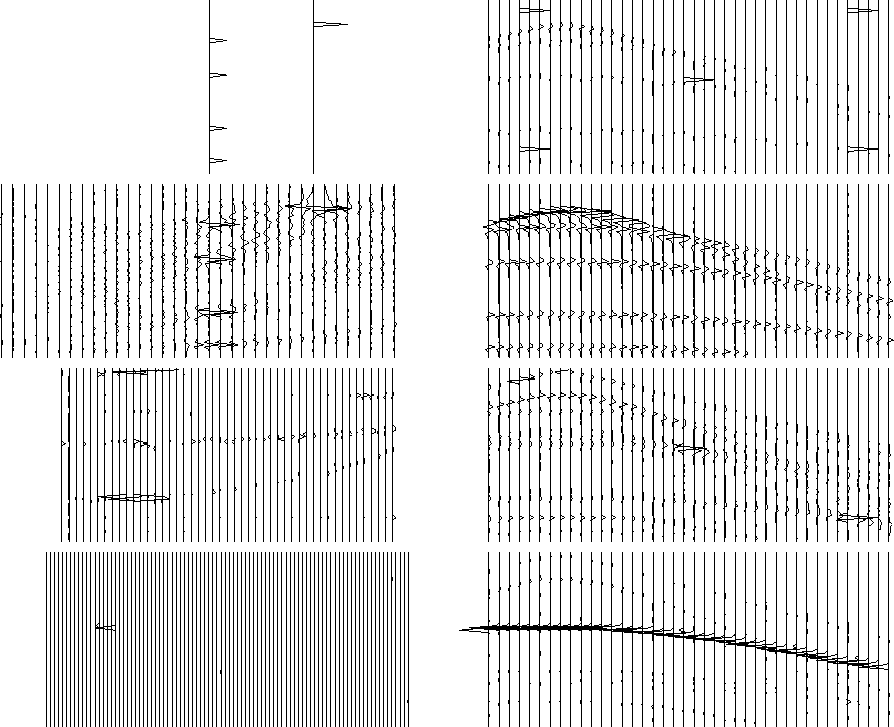
Figure ![[*]](http://sepwww.stanford.edu/latex2html/cross_ref_motif.gif) shows the results of the BP method when
randomly distributed spikes contaminate the data. BP had
significant trouble resolving this model. Unlike the Huber norm
implementations of Guitton and Symes (1999), the method has
no capacity to utilize the properties of the l1 norm in the data
space, and so cannot handle the large spikes. Manually limiting the
number of outer loops to seven was the only way to avoid instability.
However, this point is easy to find as the duality gap begins
increasing and the CG solver fails repeatedly to attain the input
tolerance. Regardless, the predicted data looks pretty bad, and while
the model space is sparse, the atoms that do have energy are
inappropriate.
shows the results of the BP method when
randomly distributed spikes contaminate the data. BP had
significant trouble resolving this model. Unlike the Huber norm
implementations of Guitton and Symes (1999), the method has
no capacity to utilize the properties of the l1 norm in the data
space, and so cannot handle the large spikes. Manually limiting the
number of outer loops to seven was the only way to avoid instability.
However, this point is easy to find as the duality gap begins
increasing and the CG solver fails repeatedly to attain the input
tolerance. Regardless, the predicted data looks pretty bad, and while
the model space is sparse, the atoms that do have energy are
inappropriate.
spike
Figure 3 Randomly spiked data.
Same format as explained in the caption of Figure
![[*]](http://sepwww.stanford.edu/latex2html/cross_ref_motif.gif) .
.


Next: Real data
Up: Experiments
Previous: Experiments
Stanford Exploration Project
10/14/2003
![[*]](http://sepwww.stanford.edu/latex2html/cross_ref_motif.gif) shows the results of the BP method when
addressing the problem of missing data. We can see that the predicted
data looks as accurate as the Huber norm result. The velocity model
space, however, shows considerable difference. Notice the resolution
increase over the same range of velocities and the lack of appreciable
chatter away from basis atoms. With this figure, and those to come
dealing with the synthetic examples, the predicted data looses the
wavelet character and the amplitude seems to diminish with depth.
shows the results of the BP method when
addressing the problem of missing data. We can see that the predicted
data looks as accurate as the Huber norm result. The velocity model
space, however, shows considerable difference. Notice the resolution
increase over the same range of velocities and the lack of appreciable
chatter away from basis atoms. With this figure, and those to come
dealing with the synthetic examples, the predicted data looses the
wavelet character and the amplitude seems to diminish with depth.
![[*]](http://sepwww.stanford.edu/latex2html/foot_motif.gif) Synthetic tests are designed evaluate the
method's performance to invert the HRT
under circumstances of missing data, a slow plane wave superimposed on
hyperbolic events, and spiky data space noise. Two field CMP's are
also analyzed and compared to the Huber norm result. The
dissimilarities in axes origin and formating of the plots are
unimportant. The spikes are at the correct values, and the important
thing to note in the plots is the distribution of energy around the
model space. The HRT operator used for this implementation has no AVO
qualities, although the synthetics were modeled with a wavelet and
amplitude variation.
Synthetic tests are designed evaluate the
method's performance to invert the HRT
under circumstances of missing data, a slow plane wave superimposed on
hyperbolic events, and spiky data space noise. Two field CMP's are
also analyzed and compared to the Huber norm result. The
dissimilarities in axes origin and formating of the plots are
unimportant. The spikes are at the correct values, and the important
thing to note in the plots is the distribution of energy around the
model space. The HRT operator used for this implementation has no AVO
qualities, although the synthetics were modeled with a wavelet and
amplitude variation.


