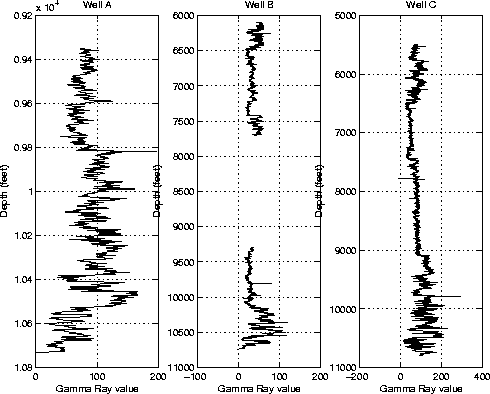
The gamma ray log is one of the most reliable logs. The well A, B and C have different depth ranges for the gamma ray log. Table 2 shows the depth range of the gamma ray log of these three wells. The depth origin is at surface, which is same as that for seismic data.
| 3cTable 2: The gamma ray log interval of the wells | ||
|---|---|---|
| Well | log start | log end |
| Well A | 3.117 km | 3.577 km |
| Well B (Part1) | 2.033 km | 2.570 km |
| Well B (Part2) | 3.100 km | 3.580 km |
| Well C | 1.831 km | 3.599 km |
The gamma ray log is most frequently used to quantify shale volume along the well Rider (1996). According to the consolided condition of rock property in this area, we used following empirical equation Atlas (1992) to calculate shale volume from gamma ray value:
| (6) |
| (7) |
The ![]() here is the gamma ray value, and are the minum and maximum value of the gamma ray.
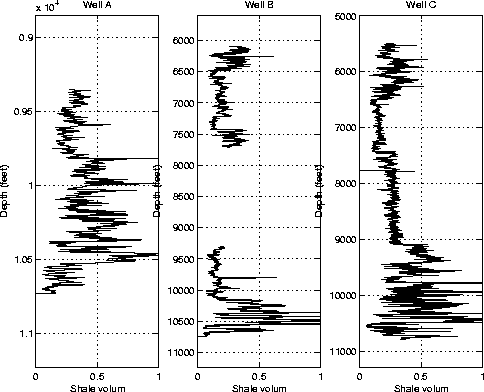
Figure 2 show the gamma ray log of these three wells. Figure 3 is the shale volume calculated by using equation (6).
here is the gamma ray value, and are the minum and maximum value of the gamma ray.
Figure 2 show the gamma ray log of these three wells. Figure 3 is the shale volume calculated by using equation (6).
|
gammaray
Figure 2 From left to right are the gamma ray log for the well A, B and C |  |
|
shaleline1
Figure 3 From left to right are the shale volume for the well A, B and C. The shale volume was calculated from gamma ray value using equation (6). I selected for A,B and C as 165,105 and 200 respectively by hand |  |