

Next: Conclusion
Up: Results of variability study
Previous: The scatterplot between AVA
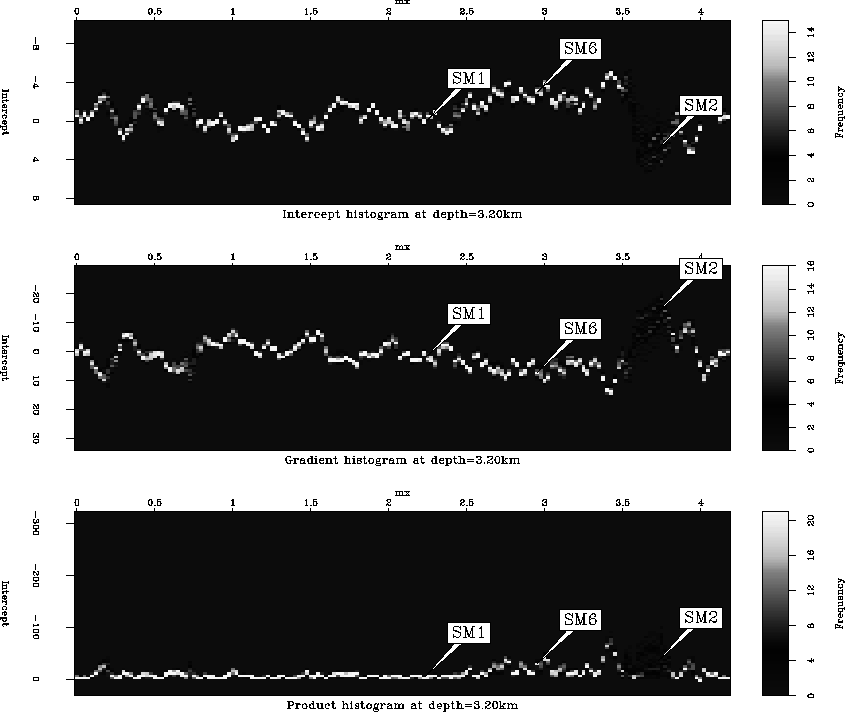
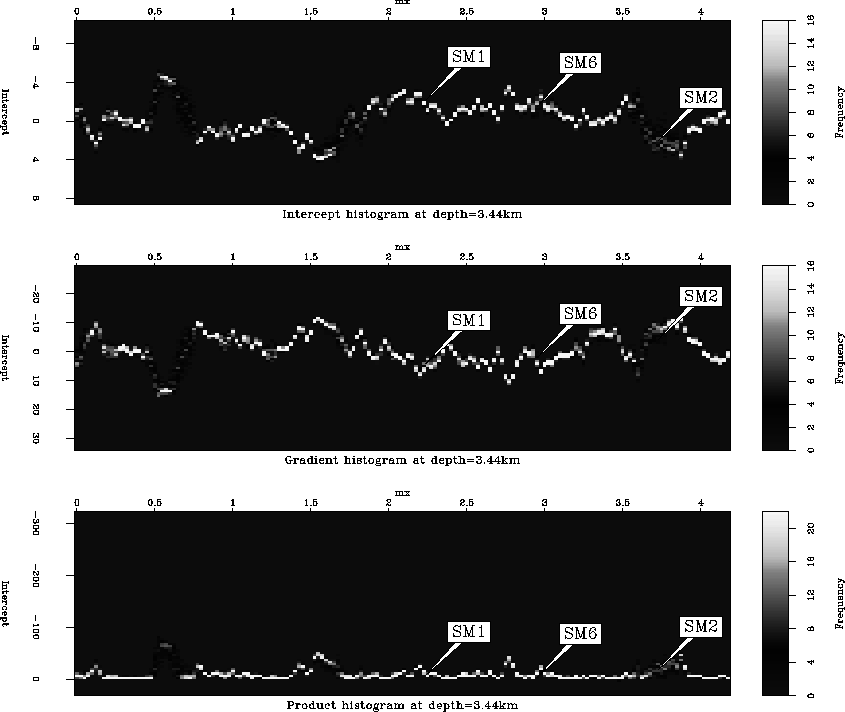
We generated the histogram cube by using 50 multiple realizations. From the histogram, we found the AVA attributes along well B have obviously bigger avearage uncertainty than well A and well C in the depth range we studied. Figure 5 and Figure 6 show the depth slice at 3.20km and 3.43km respectively from histogram cube. The low shale volume along the well B in the depth window make us guess the low shale shale/sand ratio causes hig AVA uncertainty here.
320.ann
Figure 5 The depth slice of histogram cube at 3.20km. The origin of CMPX in this plot is at CMPX=1.65km


 343.ann
Figure 6 The depth slice of histogram cube at 3.43km. The origin of CMPX in this plot is at CMPX=1.65km


Next: Conclusion
Up: Results of variability study
Previous: The scatterplot between AVA
Stanford Exploration Project
11/11/2002


