

Next: Random Traces
Up: Time-variant Filtering
Previous: Time-variant Filtering
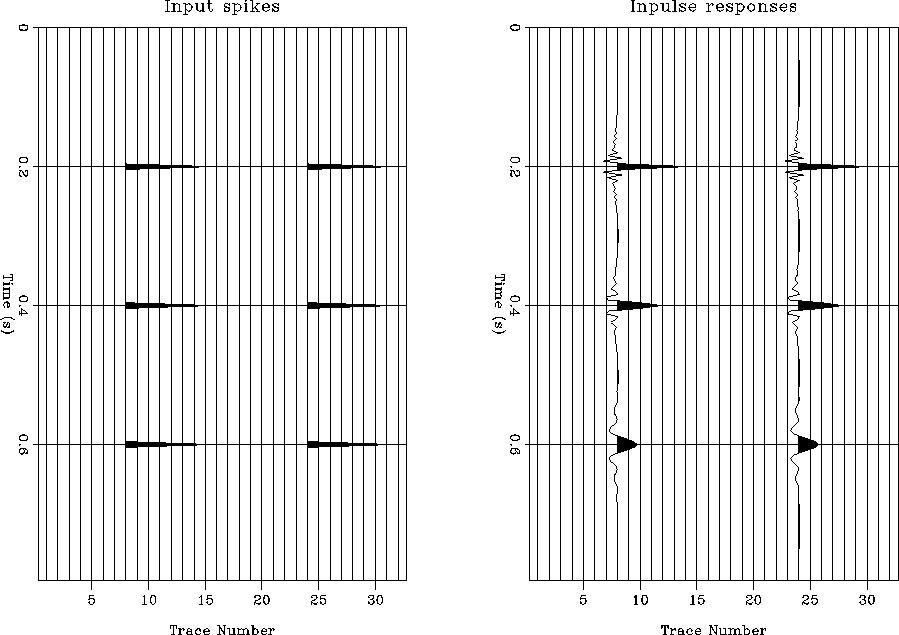
Figure 3 shows a synthetic dataset comprising six spikes and their
impulse responses when the dataset is filtered with three different filters.
Convolution of a
seismic trace with this dataset will filter it in the time-variant manner
implied by the right panel of Figure 3.
tvf_ir1
Figure 3 Impulse responses. On the left, the input
spikes and on the right their corresponding impulse responses.


 tvf_rt1
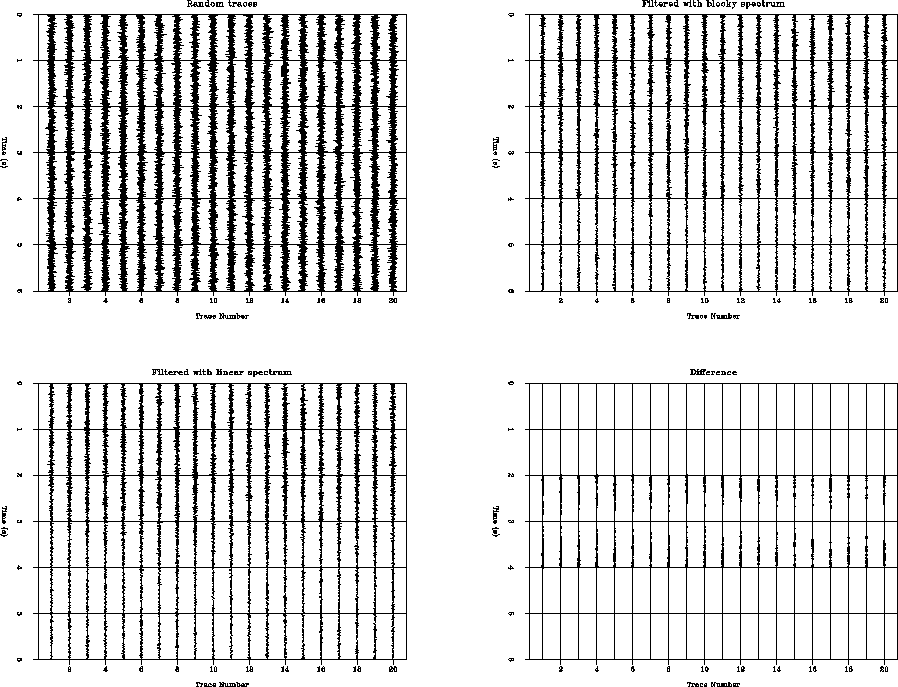
Figure 4 Random traces. On the top left, the input
data. On the top right the filtered data with a ``blocky spectrum,'' that is,
constant spectrum in each of three time windows corresponding to one third
of the trace length. On the bottom left data filtered
with a linear spectrum in the middle third and constant spectrum in the top
and bottom third. On the bottom right is the difference of the two filtered
datasets.


Next: Random Traces
Up: Time-variant Filtering
Previous: Time-variant Filtering
Stanford Exploration Project
6/8/2002


