

Next: Mechanisms
Up: Artman: 4D
Previous: Search for Model
One of the initial interests mentioned earlier was the use of these
experiments to determine the compressability of reservoirs. As we
noted above that it seems unlikely we will be able measure
 and
and  , let us hope that we can at least
accomplish this. The unconsolidated deep water reservoirs commonly
found today can compress so significantly as to
- cause costly tubing collapse and demand pressure maintenance, and/or
- obviate water flood necessity for production efficiency.
These two seemingly contradictory results make it quite important to
understand the validity of these tests in order to make correct
decisions.
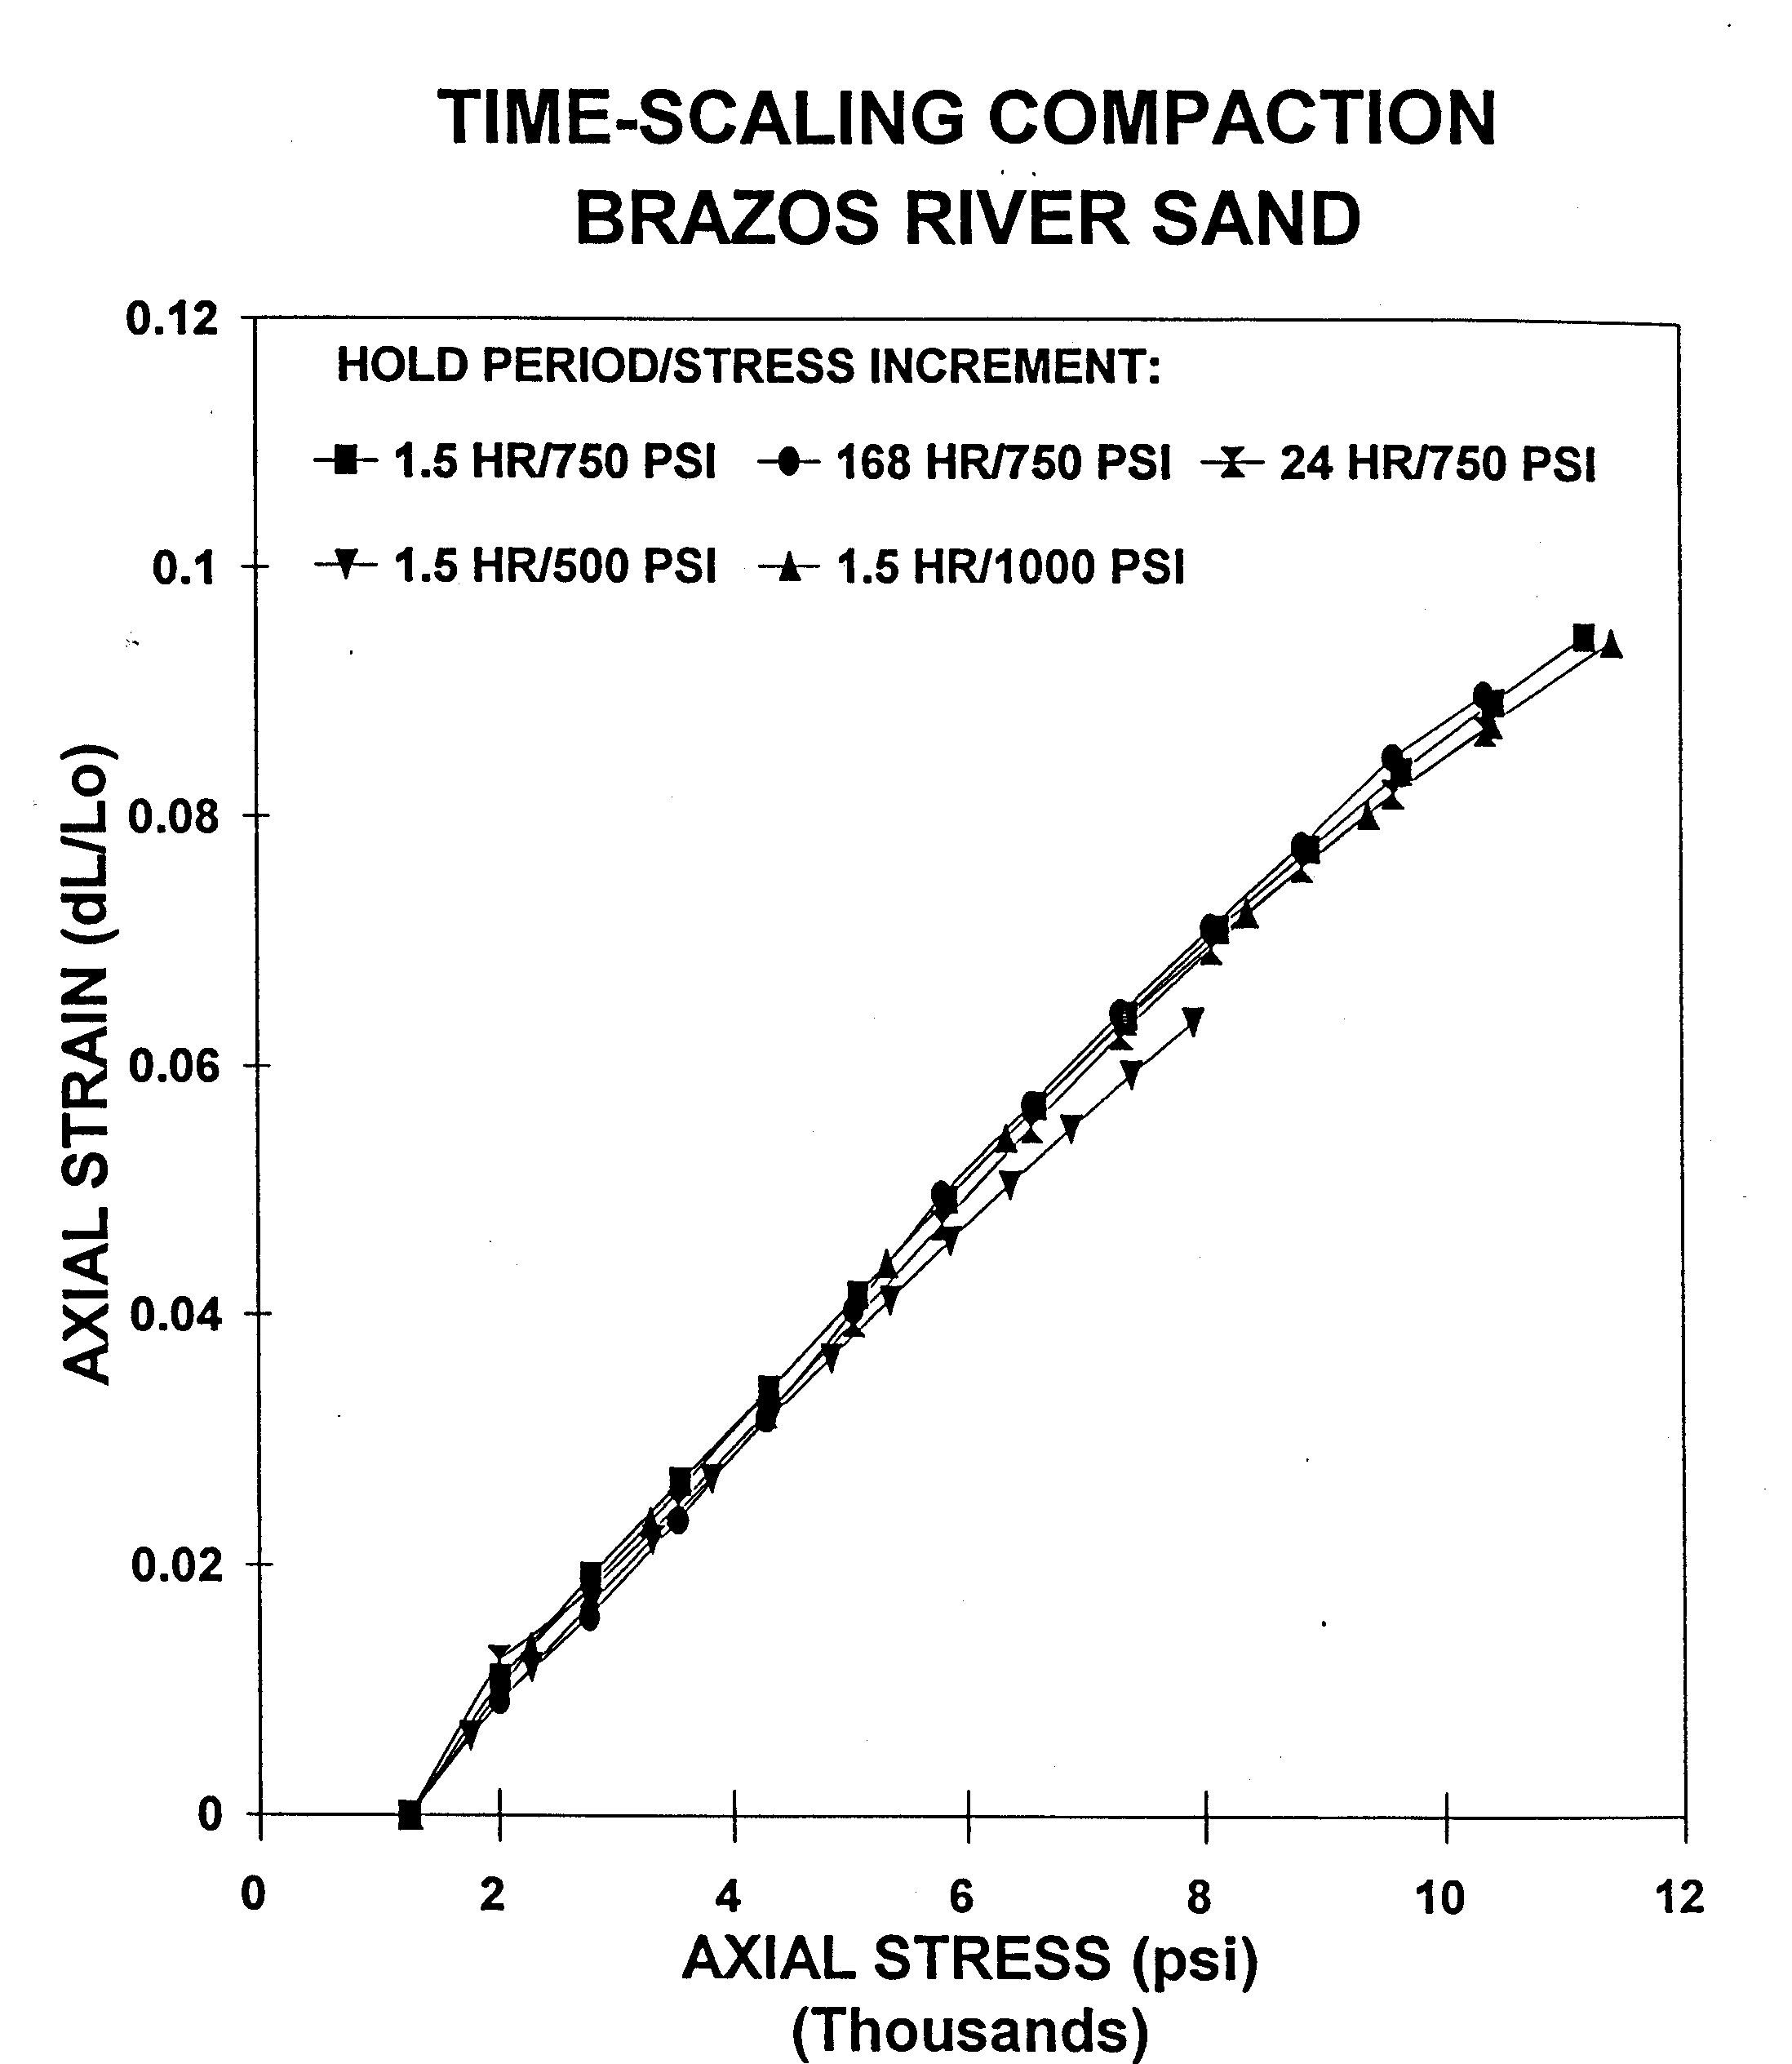
As was shown in Figure 3, that the final strain value of
each test cycle was identical and independent of the hold time, we see
that each test results in the same stress-strain behavior in Figure
5.
ss
Figure 5 Time scaling nature of the normalized
hold-cycles results in each sample attaining the same strain value at
the end of the hold time. Plotting final strain values from all
cycles tested shows overlay of stress-strain behavior.Also
important in this testing methodology is the pre-stressing of samples
to pseudo-depth pressures. This removes 'closure' errors from
consideration of the results.Dudley and Myers (1994)
|
|  |

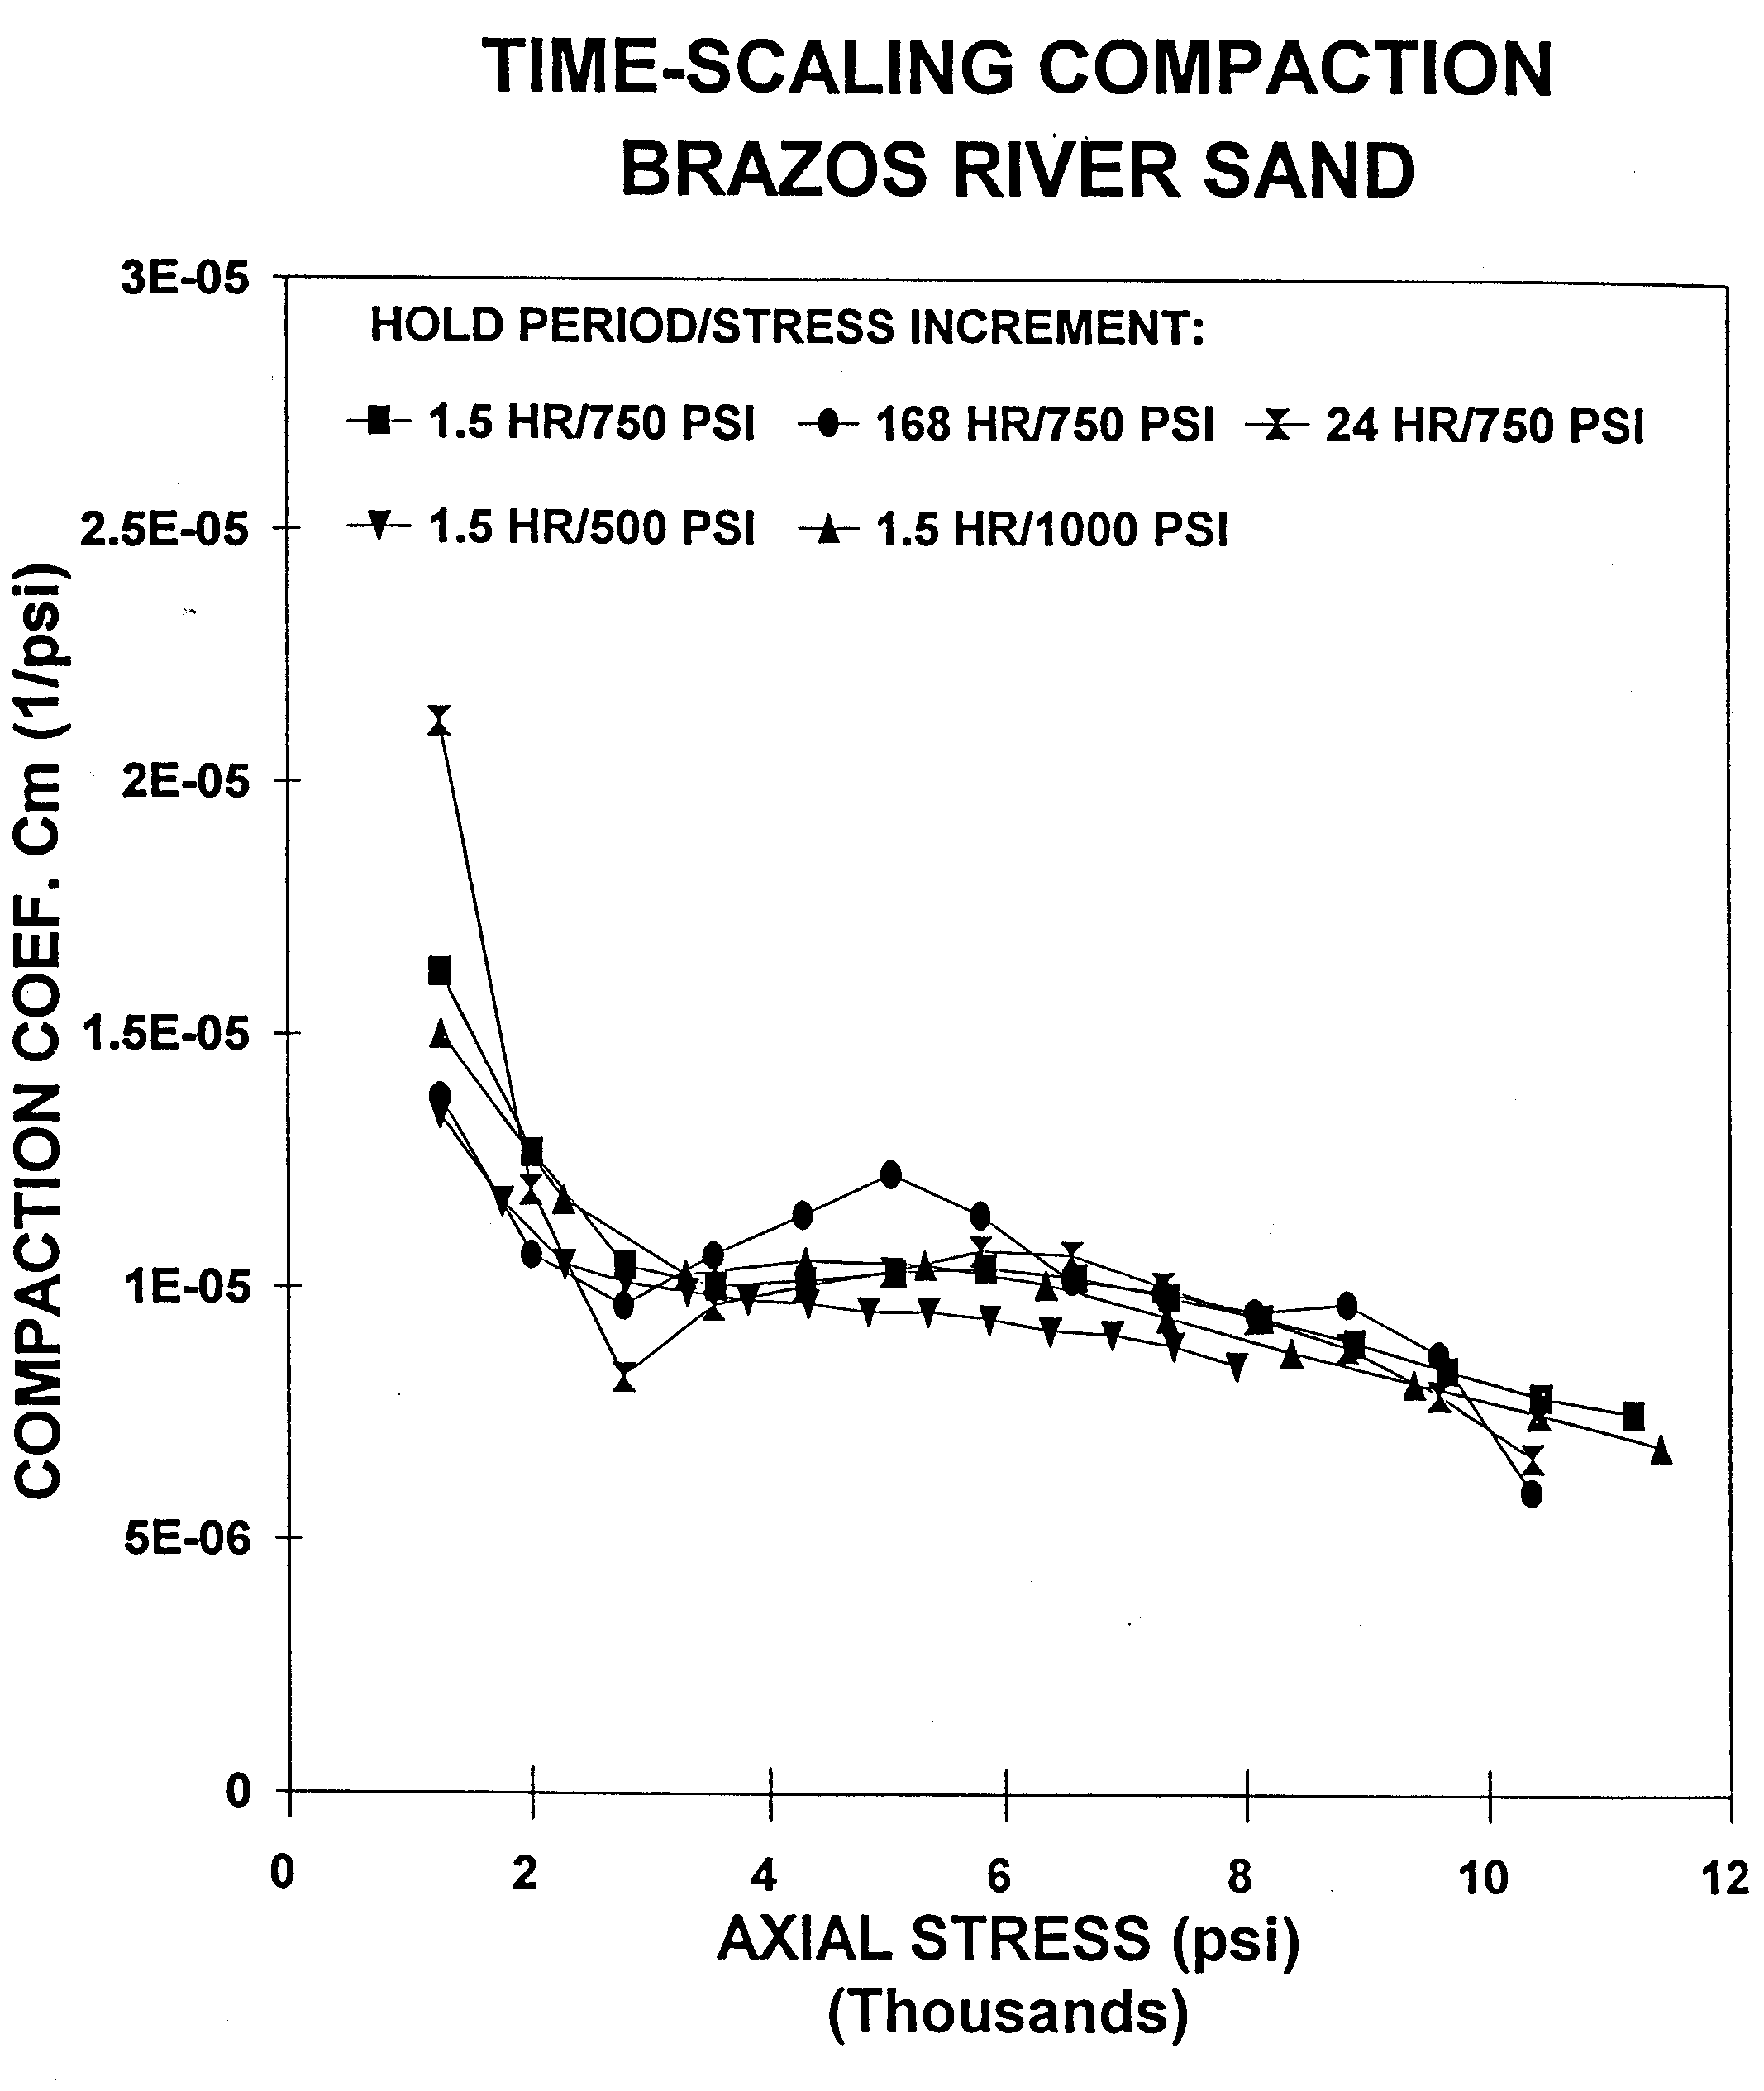
We are now free to calculate the compaction curves as a
function of pressure.![[*]](http://sepwww.stanford.edu/latex2html/foot_motif.gif) This
result will tell us the expected uniaxial compaction of a reservoir
during the drainage phase that increases the vertical effective stress
(VES) as pore pressure draws down (
This
result will tell us the expected uniaxial compaction of a reservoir
during the drainage phase that increases the vertical effective stress
(VES) as pore pressure draws down ( ), under
the caveat that the production time does not approach the
characteristic time
  . If we violate this assumption, we will
over-predict the amount of compaction the reservoir will experience.
![[*]](http://sepwww.stanford.edu/latex2html/foot_motif.gif) This allows us
to present plots of the regressed parameter
This allows us
to present plots of the regressed parameter  versus
pressure such as Figure 6.

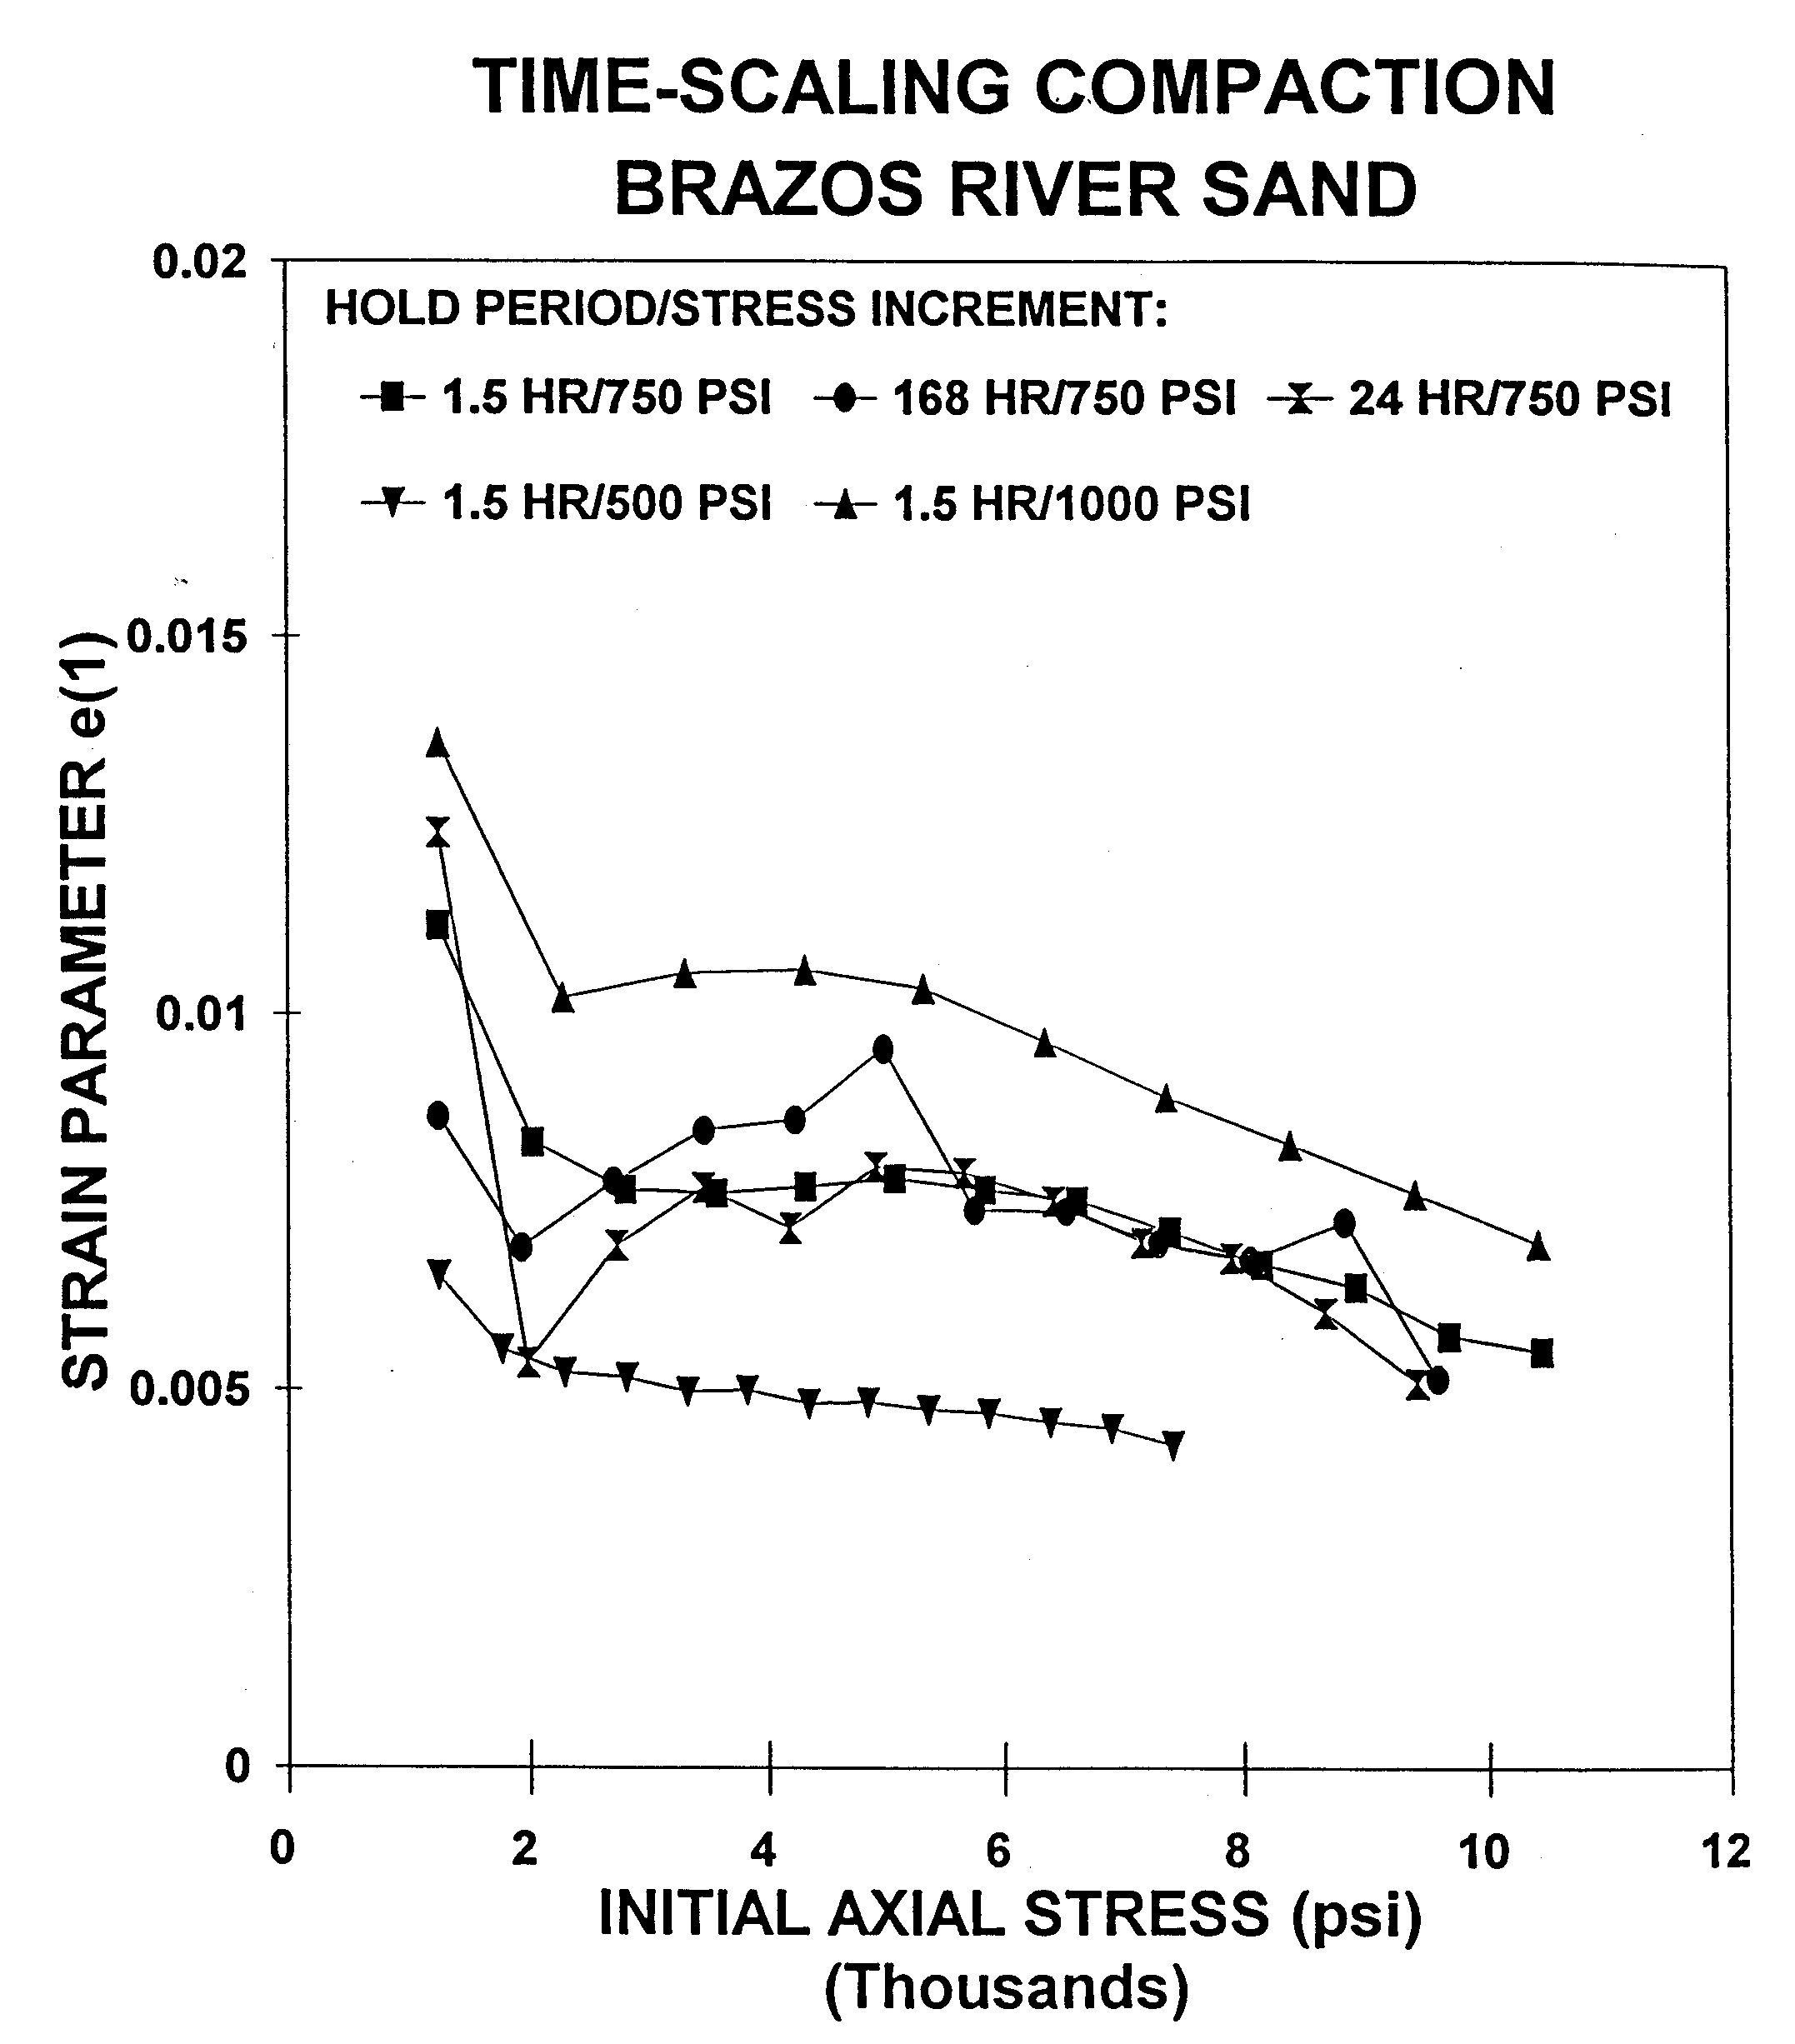
Data from several pressure step magnitudes are presented. By dividing by the
magnitude of the pressure step, we effectively calculate Cz from
equation 1 and watch the curves collapse onto one
another.
cz
Figure 7 Remarkably, uniaxial compaction coefficient
Cz as calculated by 5 different testing methodologies remain
consistent.Dudley and Myers (1994)
|
|  |

Figure 7 shows
the quite compact distribution of the Cz parameter for 5 different
samples each calculated with different stress-step and hold-time
combinations. Thus the time scaling nature of these tests results in
the pressure scaling of the tests as well due to the compulsion that the
different tests must satisfy identical stress-strain behavior (as
shown in Figure 5).


Next: Mechanisms
Up: Artman: 4D
Previous: Search for Model
Stanford Exploration Project
9/18/2001

![[*]](http://sepwww.stanford.edu/latex2html/foot_motif.gif)

