|
weightgather18
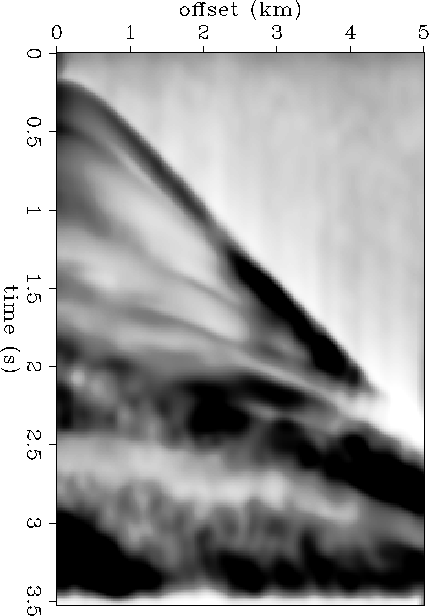
Figure 8 Data-space weighting function for the gather shown in Figure ![[*]](http://sepwww.stanford.edu/latex2html/cross_ref_motif.gif) (a). Darker
shades of grey correspond to higher amplitude. (a). Darker
shades of grey correspond to higher amplitude.
|  |
![[*]](http://sepwww.stanford.edu/latex2html/movie.gif)
![[*]](http://sepwww.stanford.edu/latex2html/cross_ref_motif.gif) shows the data-space weighting
function for the gather shown in Figure
shows the data-space weighting
function for the gather shown in Figure ![[*]](http://sepwww.stanford.edu/latex2html/cross_ref_motif.gif) (a).
Similarly, Figure
(a).
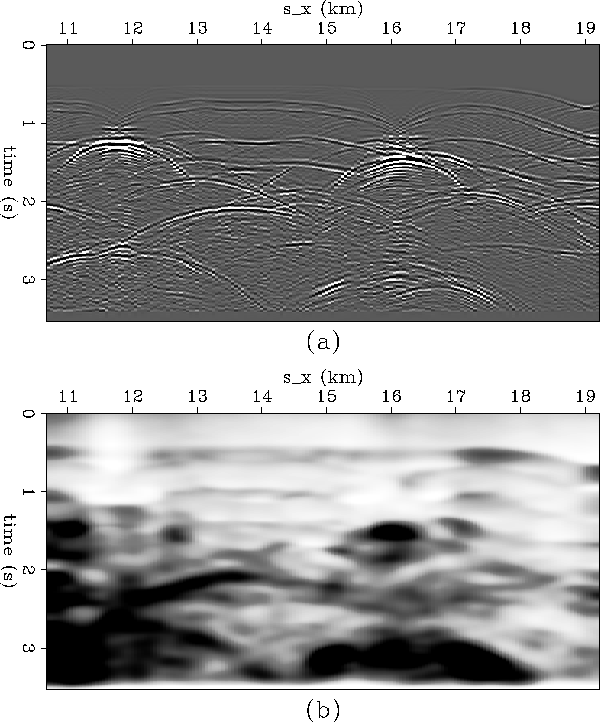
Similarly, Figure ![[*]](http://sepwww.stanford.edu/latex2html/cross_ref_motif.gif) shows the weighting
function for a common-offset section corresponding to a half-offset
of 500 m.
shows the weighting
function for a common-offset section corresponding to a half-offset
of 500 m.
|
weightgather18
Figure 8 Data-space weighting function for the gather shown in Figure ![[*]](http://sepwww.stanford.edu/latex2html/cross_ref_motif.gif) (a). Darker
shades of grey correspond to higher amplitude. (a). Darker
shades of grey correspond to higher amplitude.
|  |
![[*]](http://sepwww.stanford.edu/latex2html/movie.gif)
|
weightsection1
Figure 9 Common offset-section corresponding to h=500 m (a), and its data-space weighting function (b). Darker shades of grey correspond to higher amplitude. |  |
Unfortunately the data-space weights proved susceptible to coherent
noise in the form of multiples not predicted by the modeling
operator. While data-space weights did improve the signal in poorly
illuminated areas, they also boosted up the noise level causing an
increase in NSD.
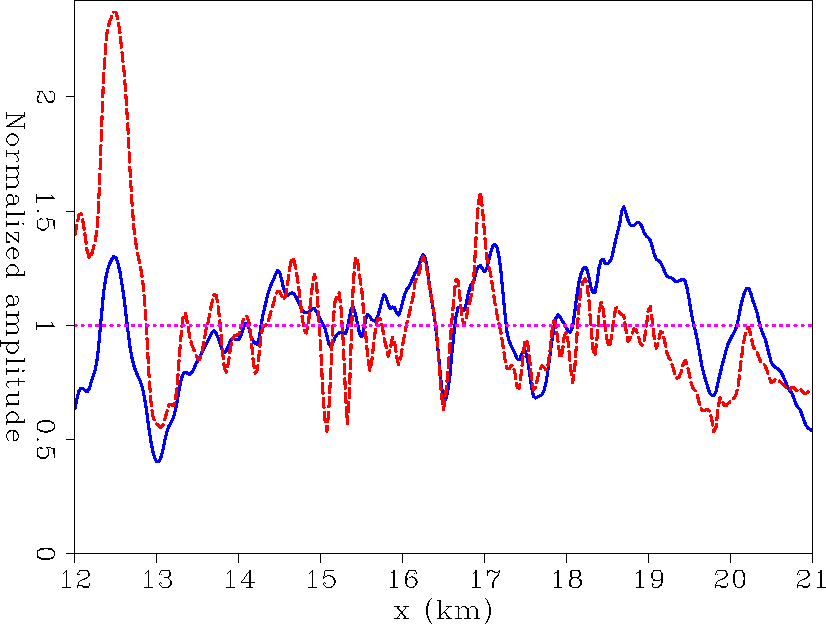
Figure ![[*]](http://sepwww.stanford.edu/latex2html/cross_ref_motif.gif) illustrates this with a plot to compare
with Figure
illustrates this with a plot to compare
with Figure ![[*]](http://sepwww.stanford.edu/latex2html/cross_ref_motif.gif) . While the reliability of the
amplitudes are increases in some areas (notably around x=19 km), in
other areas, especially x<13 km, there are obvious artifacts.
Because of the large (non-Gaussian) outliers visible in
Figure
. While the reliability of the
amplitudes are increases in some areas (notably around x=19 km), in
other areas, especially x<13 km, there are obvious artifacts.
Because of the large (non-Gaussian) outliers visible in
Figure ![[*]](http://sepwww.stanford.edu/latex2html/cross_ref_motif.gif) the normalized standard deviation is no
longer a meaningful measure of reliability.
the normalized standard deviation is no
longer a meaningful measure of reliability.
|
eventampnd5
Figure 10 Normalized peak amplitude of 3.9 km reflector after migration of the raw data (solid line), and after migration of a dataset that has been normalized by an appropriate data-space weighting function (dashed-line). Compare with Figure ![[*]](http://sepwww.stanford.edu/latex2html/cross_ref_motif.gif) . .
|  |