

Next: RTT implementation
Up: Sources of inaccuracy
Previous: Limited offset and depth
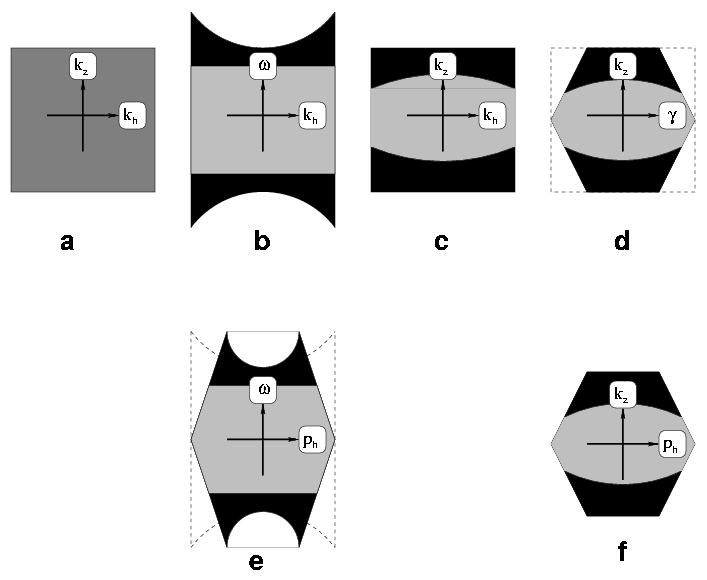
Another major source of inaccuracy is the limited temporal frequency
band of the recorded data. Figure 5 schematically explains
this phenomenon. We begin with an image gather in the offset domain, perfectly
described in its limited kz-kh band (a). From the image we model data
described in  coordinates (b). In the case of wide temporal
frequency bands, we record the entire data (b, black shape).
After migration, we return to the image domain (c, black shape) described by
kz-kh coordinates, from which we compute angle-gathers by RTT
(d, black shape). Inverse Fourier transform along kz brings us back in the
angle domain, with correct amplitudes for all angles smaller than
  .
.
Alternatively, we can record a narrower frequency band (b, gray shape).
After migration, we obtain the image as described by the DSR equation
(c, gray shape). Conversion to angle follows the same style as in the
full-band case (d, gray shape). The major distinction between the two cases
is that we do not recover correct amplitudes even for the
( ) range.
Again, this second cause of inaccuracy is related to
data sampling and cannot be corrected during processing.
One possible way to recover consistent amplitudes is to low-pass-filter the
angle-domain gathers to appropriate maximum depth wavenumbers (kz).
The same logic applies to offset ray-parameter gathers, as depicted in
Figure 5 (e,f).
adconv
Figure 5 Schematic simulation of migration,
modeling and conversion to the angle domain.
For angle-domain gathers, start with the image in (a), model to obtain
the data in (b), migrate (c), and convert to angle (d).
For offset ray-parameter gathers, start with the image in (a), model to
obtain the data in (b), convert to offset ray-parameter in the data space (e),
and image (f).
The black shapes correspond to a wide temporal frequency band, and the gray
shapes correspond to band-limited data.


Next: RTT implementation
Up: Sources of inaccuracy
Previous: Limited offset and depth
Stanford Exploration Project
4/30/2001
![]() ) range.
) range.
