

Next: Ratio of Compliance Differences
Up: EXAMPLES
Previous: EXAMPLES
The analytical results obtained here for the dry case could be improved
somewhat several different ways. Instead of replacing
 by
by  , we could have replaced it by the fixed point value
 obtained in Appendix B. Since the fixed point is an attractor
and the values rapidly approach
  for small but finite volume
fractions, this approximation would guarantee an improved
approximation over most of the range of crack volume
fraction. However, it will
make the approximation a little worse in the very small volume fraction
region. It has been and will continue to be
a significant advantage for our analysis
to have formulas valid in the small
  limit, so we have chosen
not to do this here.
Alternatively,
instead of choosing either of the extreme values of
  ,we could use their
mean, their harmonic mean, or their geometric mean, etc., with similar
benefits and drawbacks.
Or, we could make direct use of the results from Appendix B
for the decoupled equation for Poisson's ratio. This approach will
improve the results over the whole range of volume fractions, but
will complicate the formulas considerably. We want to emphasize,
however, that our goal here has not been
to achieve high accuracy in the analytical approximation,
but rather to gain insight into what the
equations were computing and why. Having accomplished this even with
the simplest approximation
  , we do not think it
fruitful to dwell on this issue and we will therefore
leave this part of the subject for now.
For the interested reader, some additional technical justifications of
the analytical approximation are provided in Appendix C.
Next we want to do
more detailed comparisons between these
results and those of Gassmann (1951) and of Mavko and Jizba (1991)
in the remainder of the paper.
allk1pg
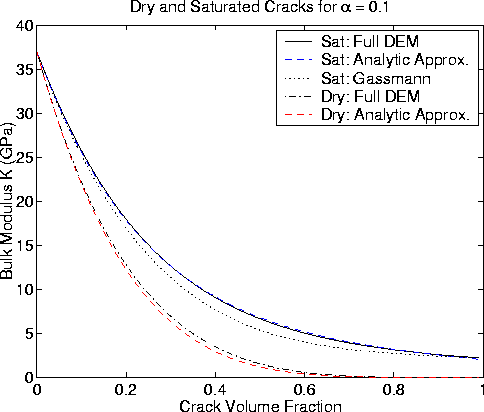
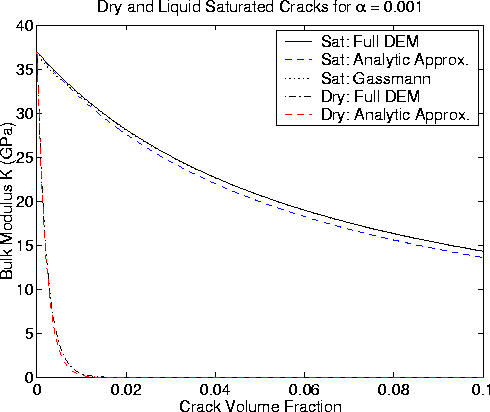
Figure 1
Bulk modulus for dry and liquid saturated cracked porous
media with  .Full DEM calculation is shown as a solid line for the
saturated case and as a dot-dash line for the dry case.
The analytical approximations in the text are displayed as a dashed line for
both dry and saturated cases. Agreement between full DEM and analytical
approximation is excellent in both cases.
Gassmann's prediction is shown by the dotted line.
 allmu1pmj
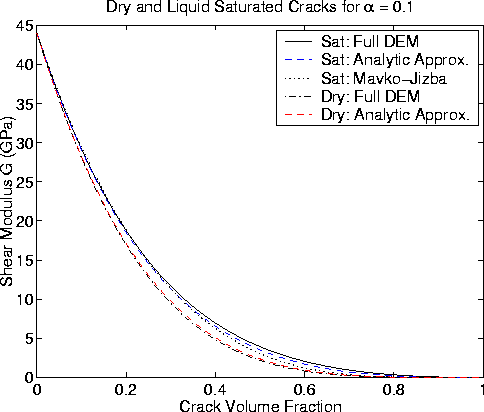
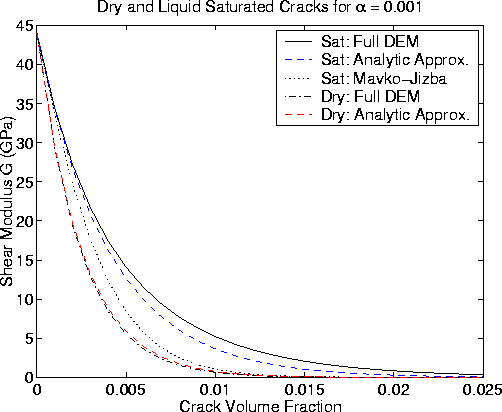
Figure 2
Shear modulus for dry and liquid saturated cracked porous
media with  .Full DEM calculation is shown as a solid line for the
saturated case and as a dot-dash line for the dry case.
The analytical approximations in the text are displayed as a dashed line for
both dry and saturated cases. Agreement between full DEM and analytical
approximation is again excellent in both cases.
The Mavko-Jizba (1991) prediction is shown by the dotted line.
 allk01pg
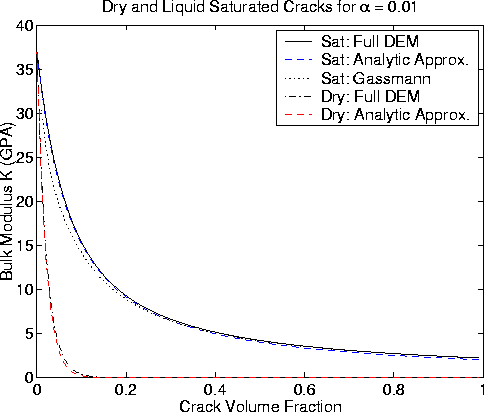
Figure 3
Same as Figure 1 for  .
.
 allmu01pmj_25
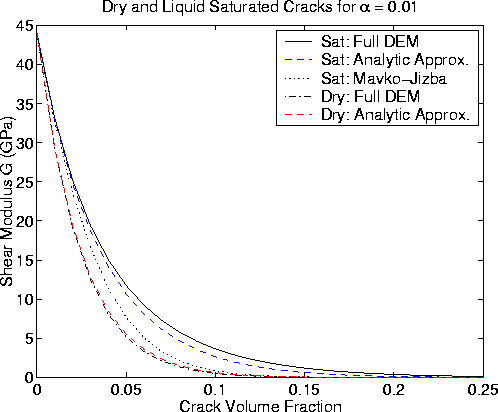
Figure 4
Same as Figure 2 for  .Note that the Mavko-Jizba agreement is poor except at low porosities
(
 ).
).
 allk001pg_0.1
Figure 5
Same as Figure 1 for  .Gassmann (1951) is in very good agreement with DEM for this case.
 allmu001pmj
Figure 6
Same as Figure 2 for  .Again, note that the Mavko-Jizba prediction is in poor agreement
except at very low porosities (
 ).
).


Next: Ratio of Compliance Differences
Up: EXAMPLES
Previous: EXAMPLES
Stanford Exploration Project
4/29/2001
![]() by
by ![]() , we could have replaced it by the fixed point value
, we could have replaced it by the fixed point value
![]() obtained in Appendix B. Since the fixed point is an attractor
and the values rapidly approach
obtained in Appendix B. Since the fixed point is an attractor
and the values rapidly approach ![]() for small but finite volume
fractions, this approximation would guarantee an improved
approximation over most of the range of crack volume
fraction. However, it will
make the approximation a little worse in the very small volume fraction
region. It has been and will continue to be
a significant advantage for our analysis
to have formulas valid in the small
for small but finite volume
fractions, this approximation would guarantee an improved
approximation over most of the range of crack volume
fraction. However, it will
make the approximation a little worse in the very small volume fraction
region. It has been and will continue to be
a significant advantage for our analysis
to have formulas valid in the small ![]() limit, so we have chosen
not to do this here.
Alternatively,
instead of choosing either of the extreme values of
limit, so we have chosen
not to do this here.
Alternatively,
instead of choosing either of the extreme values of ![]() ,we could use their
mean, their harmonic mean, or their geometric mean, etc., with similar
benefits and drawbacks.
Or, we could make direct use of the results from Appendix B
for the decoupled equation for Poisson's ratio. This approach will
improve the results over the whole range of volume fractions, but
will complicate the formulas considerably. We want to emphasize,
however, that our goal here has not been
to achieve high accuracy in the analytical approximation,
but rather to gain insight into what the
equations were computing and why. Having accomplished this even with
the simplest approximation
,we could use their
mean, their harmonic mean, or their geometric mean, etc., with similar
benefits and drawbacks.
Or, we could make direct use of the results from Appendix B
for the decoupled equation for Poisson's ratio. This approach will
improve the results over the whole range of volume fractions, but
will complicate the formulas considerably. We want to emphasize,
however, that our goal here has not been
to achieve high accuracy in the analytical approximation,
but rather to gain insight into what the
equations were computing and why. Having accomplished this even with
the simplest approximation ![]() , we do not think it
fruitful to dwell on this issue and we will therefore
leave this part of the subject for now.
For the interested reader, some additional technical justifications of
the analytical approximation are provided in Appendix C.
, we do not think it
fruitful to dwell on this issue and we will therefore
leave this part of the subject for now.
For the interested reader, some additional technical justifications of
the analytical approximation are provided in Appendix C.
