Next: Conclusion
Up: Gratwick: AVO
Previous: Synthetic Data Example
The real data used in this study were provided by WesternGeco. The synthetic
model used in the previous section was modeled after this real dataset. Thus many of the imaging problems faced
in the synthetic data presented themselves in the real data. Since we had a rough idea of the subsurface
geology, the velocity analysis was relatively easy. The actual geology and synthetic model are
likely very different, but the size and shape of the salt body is fairly uniform between the two,
and the velocity gradients
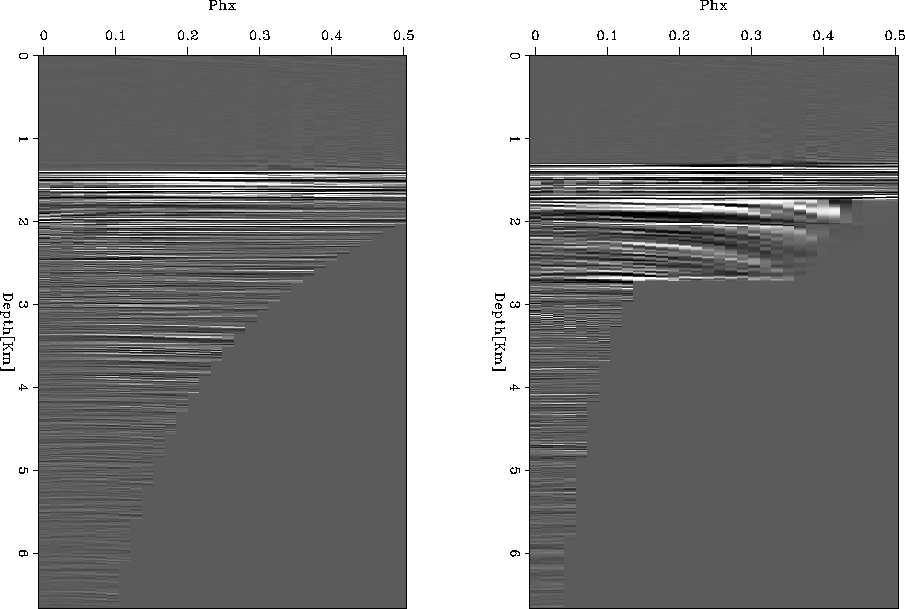
are comparable. Figure 11 shows extracted image gathers from both outside and under the salt.
We can see that the events are relatively flat,
so our AVA algorithm should work well.
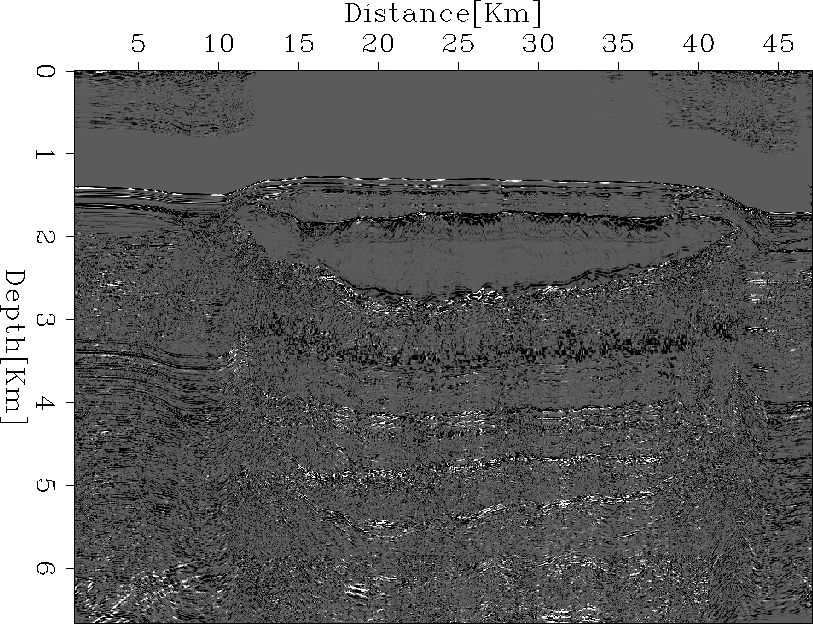
Figure 12 shows the stack of the angle gathers. There are a few notable bright spots
around the right side of the salt and closer to the bottom of the salt that may correspond to hydrocarbons.
gulf_ig
Figure 11 Angle gather from outside the salt (left) and in the salt (right).


 gulf_stack
Figure 12 Image obtained from stacking angle gathers.
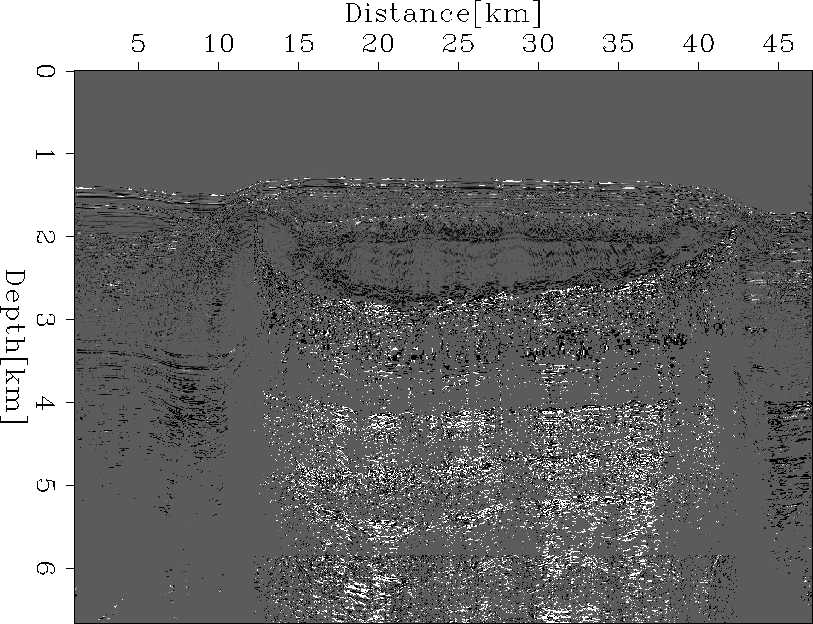
gulf_AB
Figure 13 Original A*B image showing some bright spots under right margin of salt
at about 43 km.
AxB_data_gulf
Figure 14 A*B after mute algorithm, isolating the bright spots of
the previous figure (especially directly below salt).
The A*B image of the WesternGeco data is shown in Figure 13, and the image after the AVA muting algorithm
is show in Figure 14. Overall, the AVA algorithm seems to have
worked well, with the A*B image confirming that the bright spots in the stacked image could very well
be reflections from a low impedance gas or oil sand. Similar to the synthetic image, the algorithm helps
to illuminate reflectors under the salt. However, the real data image seems to have even less energy under the salt. This
is expected since the wavefield in the real data undergoes a lot more scattering than in the synthetic model.
Next: Conclusion
Up: Gratwick: AVO
Previous: Synthetic Data Example
Stanford Exploration Project
4/29/2001