The velocity gradients were chosen in order to simulate a typical near seafloor velocity profile: the P-velocity model consists of an initial velocity of 1700 m/s and a gradient of 0.15 s-1. On the other hand, the S-velocity model has an initial velocity of 300 m/s and a gradient of 0.35 s-1.
We used ray-tracing in order to generate the data set.
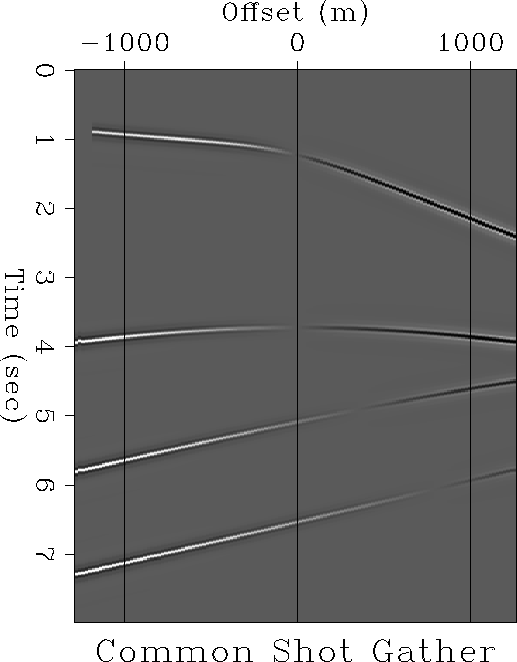
Figure 4 shows a common shot gather located in the
center of the model.
It is possible to note that the polarity flip
varies with respect to the travel time as a
function of the reflector dip and the ![]() ratio (Figure 2).
ratio (Figure 2).
|
csg2
Figure 4 Common shot gather, taken in the middle of model. |  |
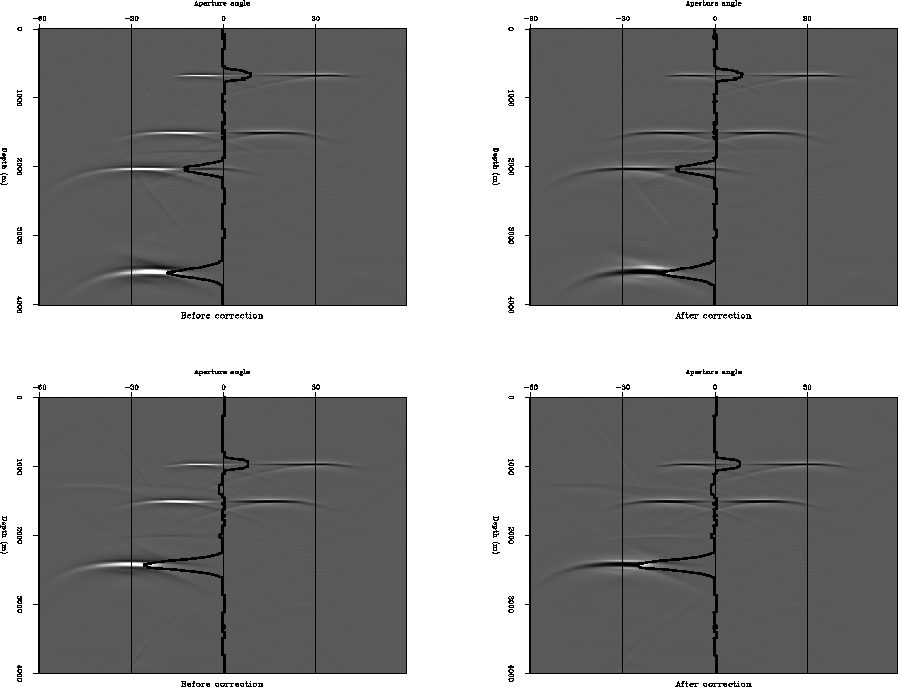
Figure 5 shows two angle-domain gathers after (left) and
before (right) the polarity correction in the angle domain.
The events in the common angle gathers are flat, this is not obvious for the
![]() event in the top of Figure 5, because of
the low coverage in the modeling for that event at that depth. However, it is possible to
observe that this event gets flatter with the rise in the fold, bottom
of Figure 5. The flatness in the gathers implies that we used the correct velocity model for
the migration. Moreover, it is possible to observe in the
common angle gather before the correction that the same event changes its
polarity. The point for this change is the polarity flip angle
(
event in the top of Figure 5, because of
the low coverage in the modeling for that event at that depth. However, it is possible to
observe that this event gets flatter with the rise in the fold, bottom
of Figure 5. The flatness in the gathers implies that we used the correct velocity model for
the migration. Moreover, it is possible to observe in the
common angle gather before the correction that the same event changes its
polarity. The point for this change is the polarity flip angle
(![]() ) determined by equation (9).
With the P and S velocity models used for the migration and
the dip map estimated by plane-wave destructors, we calculate the
curve superimposed on the common angle gather, this curve represents
the polarity flip angle. The angle-domain gather after the
correction for the polarity inversion is in the right of
Figure 5. It is clear that our methodology correctly
handles the polarities after migration.
) determined by equation (9).
With the P and S velocity models used for the migration and
the dip map estimated by plane-wave destructors, we calculate the
curve superimposed on the common angle gather, this curve represents
the polarity flip angle. The angle-domain gather after the
correction for the polarity inversion is in the right of
Figure 5. It is clear that our methodology correctly
handles the polarities after migration.
 |
Figure 6 presents the final migration results. The top represents the result with the correction in the model space (flipping in the angle domain), the center represents the result with the correction in the data space (flipping the negative offsets), and the bottom represents the migration result without any correction. It is possible to observe that the correction in the model space perfectly recovered all the events with a strong illumination; the correction in the data space produced a weaker image for the dipping events; no correction resulted in the loss of the flat event.