Two data sets were modeled in this paper. One data set was used for the AVO analysis and the other for the velocity analysis. Both modeling were done using the velocity interpolation result, and the main difference in both models is the velocity slice used. The AVO model was done over one velocity slice with a good definition of the sand lens for fluid substitution purpose. The velocity analysis model was done over another velocity slice containing one well in order to make the comparison of seismic and well velocities.
A synthetic modeling program, which solves the 2D elastic wave equation by explicit finite difference 2nd order in time and 16th order in x and z, was used for the modeling of the two data sets presented here. Both models consisted of 60 shots and 100 receivers per shot, with an spacing of 2 m between shots and receivers. The maximum two-way travel time was 0.1750 sec.
Since the sand body selected for the AVO study has a width of 50 m, with an average
velocity of 2700 m/s, A wavelet with a wavelength less than 50 m is necessarily in order
to have a good resolution of top and bottom of our target,
because of this
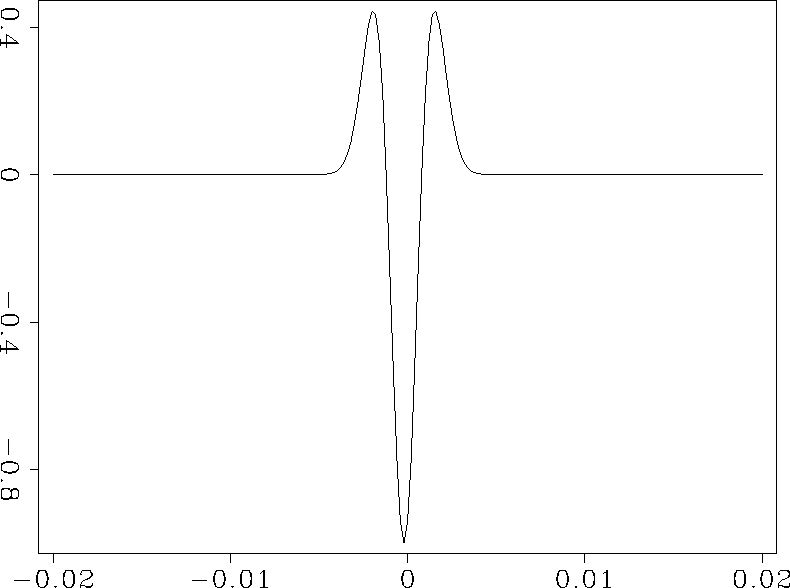
a Ricker zero-phase wavelet with a maximum frequency of 500 hz was used
for both modeling, with a wavelength of 5.4 m (![]() ),
Figure 10 shows the wavelet used in the modeling.
),
Figure 10 shows the wavelet used in the modeling.
|
Wav
Figure 10 Ricker wavelet used for the modeling. |  |
Figures 11 and 12 shows common shot gathers (CSG) in the AVO model taken at 2000 m before and after the fluid substitution, respectively. It is possible to note the first arrival both for P and S waves. The top and bottom reflection of our target are visible in the common shot gather after the fluid substitution. The presence of both reflections is not easily distinguished in the CSG before the fluid substitution because of the low impedance constrant of the body, this result will be discused in the next section.
 |
 |
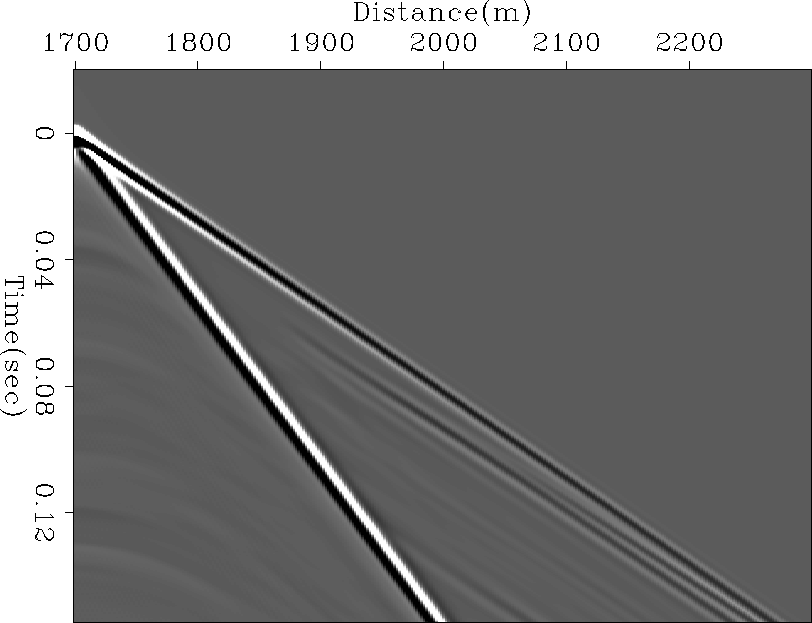
Since the velocity analysis will be done for P velocities only, the velocity analysis model consists only of P wave information, Figure 20 shows a common shot gather of the velocity analysis model. It is possible to note the P wave first arrival and a series of weak reflection hyperbolas.
Prior to the analysis of the modeling results it is necessary to make a brief processing of the data obtained in this section of the work. This processing and analysis will be presented in the next section.