

Next: Two-dimensional residual migration
Up: Applications
Previous: Applications
Figure 1 shows a seismic section from which I drew two
hypothetical sonic logs. The task was then to match them to each
other. The fault that cuts through the section and the poor data
quality in the lower part cause problems from matching algorithms.
data
Figure 1
Seismic section from which two hypothetical sonic logs were drawn.
 was drawn at X=31 km and was drawn at X=31 km and
 was drawn at X=32 km. was drawn at X=32 km.
|
|  |


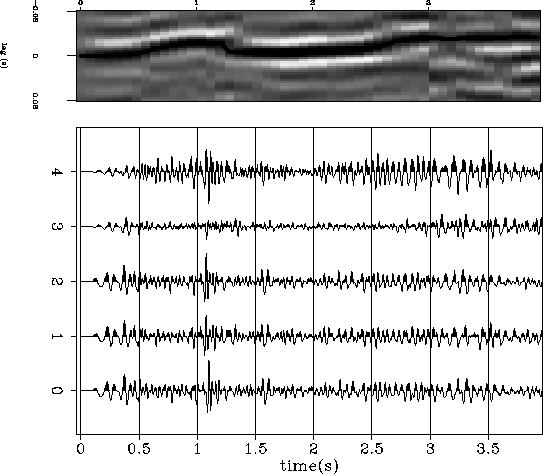
Figures 2 and 3 compare the results of
the two warping algorithms. The shaping filters themselves change
more smoothly as a function of time than the local
cross-correlelograms. The warped difference (trace 3 in both figures)
also contains less energy in Figure 3 than
Figure 2 indicating the shaping filters have found a
better match. Clip levels for the wiggle displays are the same for
both Figures 2 and 3.
xcorr1
Figure 2 Cross-correlation results.
The top panel shows cross-correlelograms and picked maxima.
The bottom panel shows
 (0),
(0),  (1),
(1),  (2),
(2),
 (3),
and
  (4).
(4).


 xcorr2
Figure 3 Non-stationary shaping filter results.
The top panel shows cross-correlelograms and picked maxima.
The bottom panel shows
 (0),
(0),  (1),
(1),  (2),
(2),
 (3),
and
  (4).
(4).


Next: Two-dimensional residual migration
Up: Applications
Previous: Applications
Stanford Exploration Project
4/27/2000


