![[*]](http://sepwww.stanford.edu/latex2html/foot_motif.gif) and has proved to be a test case for imaging
below salt flanks
Malcotti and Biondi (1998); Prucha et al. (1998). The geologic
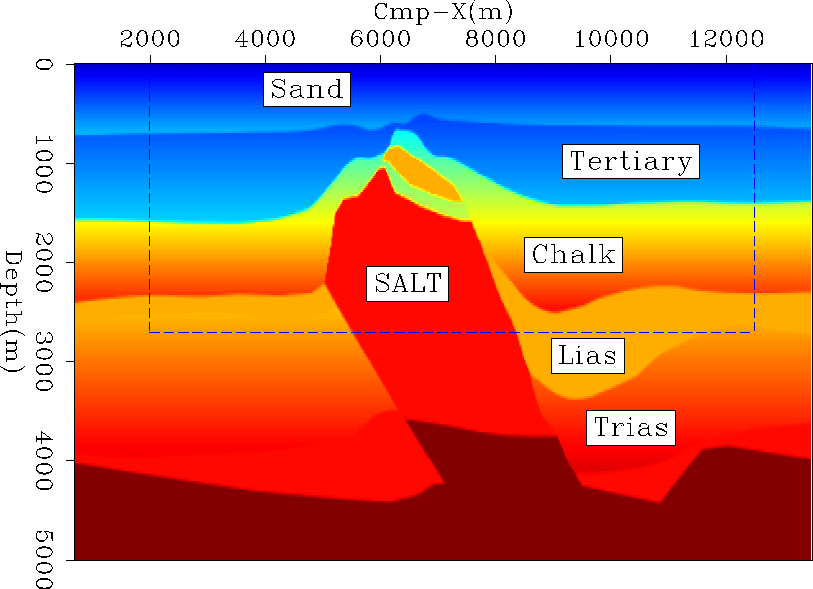
interpretation proposed by IFP comes from the analysis of the real dataset. This
geologic model will be referred to regularly in this paper.
and has proved to be a test case for imaging
below salt flanks
Malcotti and Biondi (1998); Prucha et al. (1998). The geologic
interpretation proposed by IFP comes from the analysis of the real dataset. This
geologic model will be referred to regularly in this paper.
The recorded data covers an area of ![]() km for a whole
volume of seismic information as big as 45 gigabytes. The first step
of our processing was
to perform a gridding of the whole volume and then to apply a simple
sequence NMO/binning/
km for a whole
volume of seismic information as big as 45 gigabytes. The first step
of our processing was
to perform a gridding of the whole volume and then to apply a simple
sequence NMO/binning/![]() for regularizing the data. As a
first approach to the imaging problem, we stacked the data and
migrated them using a 3-D
zero-offset extended split-step algorithm
Stoffa et al. (1990). In order to get these preliminary results
more quickly, we
used this first migrated cube to extract a subset
(Figure 1) from the whole data,
which includes most target regions of interest, such as the top of
salt and the salt flanks.
for regularizing the data. As a
first approach to the imaging problem, we stacked the data and
migrated them using a 3-D
zero-offset extended split-step algorithm
Stoffa et al. (1990). In order to get these preliminary results
more quickly, we
used this first migrated cube to extract a subset
(Figure 1) from the whole data,
which includes most target regions of interest, such as the top of
salt and the salt flanks.
 |
Because we wanted to examine how robust the method was with respect to lateral velocity variations, both in the cross-line and the in-line direction, we kept all the data along the Cmp-Y axis. By resampling the data in Cmp-X and in offset (Table 1) at the limit of aliasing, we reduced the cube dimension to less than 20 gigabytes, which is more reasonable costwise. From now on, ``data'' will always refer to this particular subset.
One could object that the most important imaging challenge for this particular model would be to focus the base of salt accurately, since it probably corresponds to the most complex propagation for the wavefield through the body itself. However, we chose not to image all the way down in this first test in order to limit the computational time. We also focused on improving the velocity model in the upper part. This choice helps us image deeper regions accurately, as we will see in the last sections of the paper.
Cmp-X
Cmp-X
Cmp-Y
Cmp-Y
Offset
Offset
range
sampling
range
sampling
range
sampling
Raw data
0-13500 m
13.33 m
1600-5600 m
25.0 m
185-3570 m
25 m
Subset
2000-12500 m
20.0 m
1600-5600 m
25.0 m
200-3400 m
50 m
 |
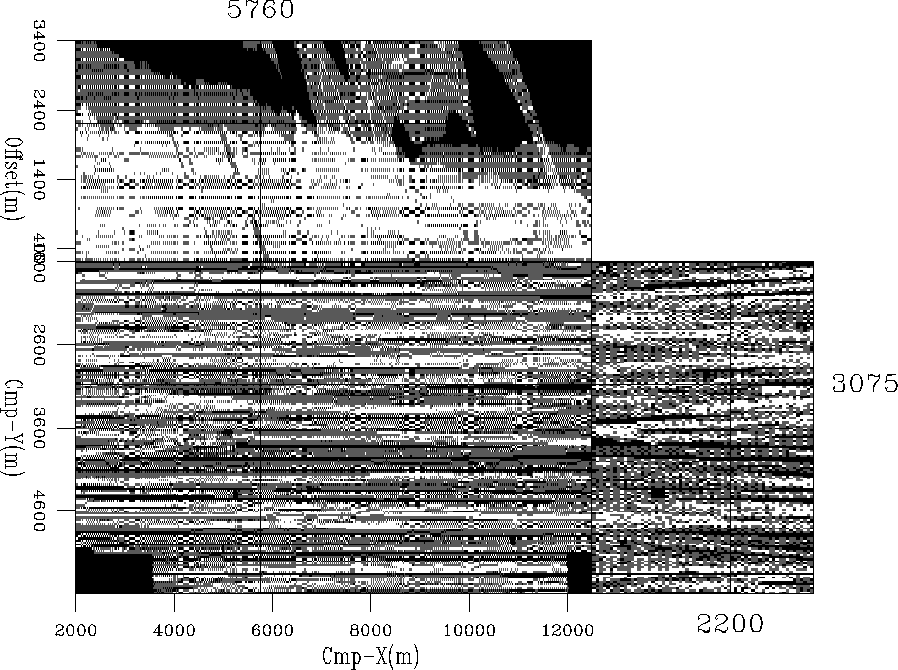
After this gridding, the data shows an irregular repartition, especially on Cmp-X vs. offset planes (Figure 2). Apparently, several geophones in the middle of the streamers went down during the acquisition, which yields a very irregular fold for the binning and large areas with no offset information.
Azimuth moveout Biondi et al. (1998) is the operator usually used for transforming the data to common-azimuth and putting them on a regular grid. We estimated that performing AMO on our data would need 7 days of computation, which is not negligible compared to the cost of the migration itself (see paragraph below). Since the data were concentrated in a narrow azimuth band, we instead used a simple binning procedure, normalized by the fold. AMO will be used for a further comparison in the near future.
The common-azimuth data obtained by NMO/binning/![]() were
migrated down to 2700m, with a depth spacing of 12.5m. We used 6
reference velocities for the extended split-step scheme that performs
migration. With the
dimensions indicated in Table 2, the 3-D prestack common azimuth
migration ran in 26 days on 4 processors of our SGI Power Challenge
(18 MIPS R8000 Processors, 2 Gbytes of memory). To put this in
context, the zero-offset migration took about 12 hours on only 2
processors of the same machine.
were
migrated down to 2700m, with a depth spacing of 12.5m. We used 6
reference velocities for the extended split-step scheme that performs
migration. With the
dimensions indicated in Table 2, the 3-D prestack common azimuth
migration ran in 26 days on 4 processors of our SGI Power Challenge
(18 MIPS R8000 Processors, 2 Gbytes of memory). To put this in
context, the zero-offset migration took about 12 hours on only 2
processors of the same machine.
6c|Number of samples
Cmp-X
Cmp-Y
Depth
Offset
Frequencies
Velocities
Subset
525
160
216
64
150
6