 |
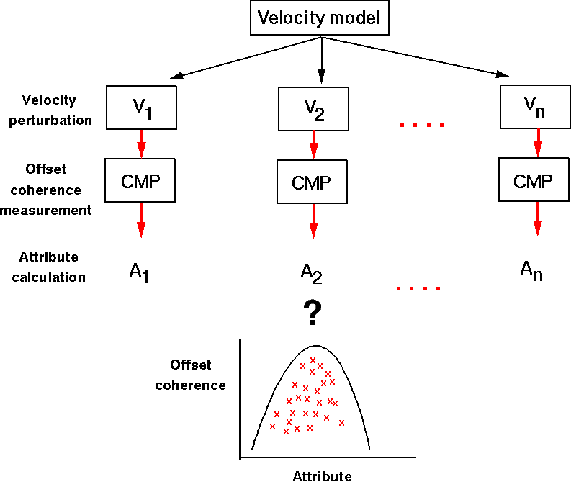
Figure 2 A procedural scheme for generating the crossplots of attribute versus velocity coherence
To identify any relation between AVO-related seismic attributes and velocity uncertainty, we generated several crossplots of attribute versus velocity coherence measures. The procedure for generating the final data to be plotted is illustrated in Figure 2.
 |
From an initial velocity model, we generated several realizations that are perturbations of the original velocity model. The original model used for this work is shown in Figure 3. There is a low velocity zone beneath the BSR associated with the zone of gas-saturated sediments. Because of the complexity of this zone, the velocity estimation is difficult and migration velocity may contain errors. We assume these errors are zero-mean random variations, therefore, we introduce this kind of perturbation into the original velocity model to generate each realization.
|
model
Figure 3 The original velocity model. There is a low velocity zone starting at CMP distance of about 32 km. | 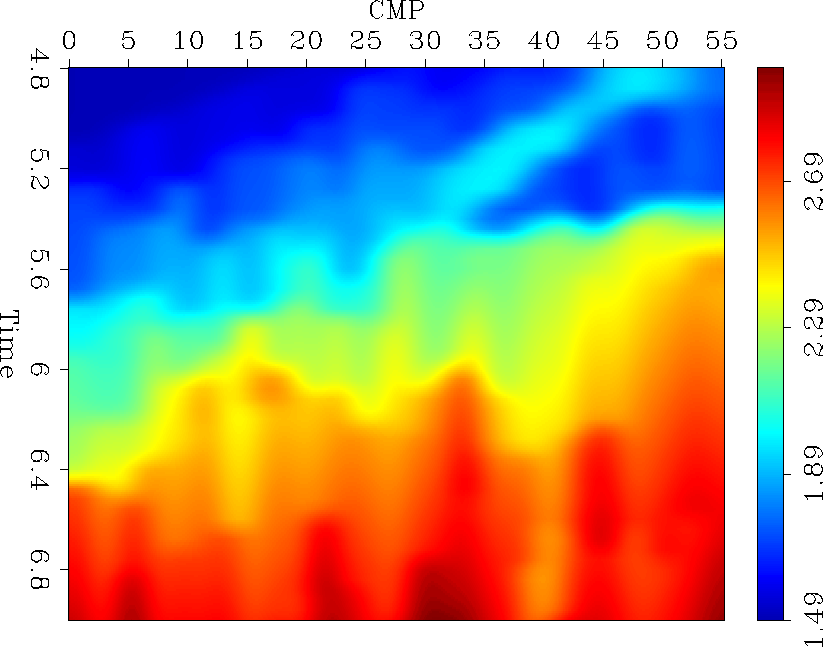 |
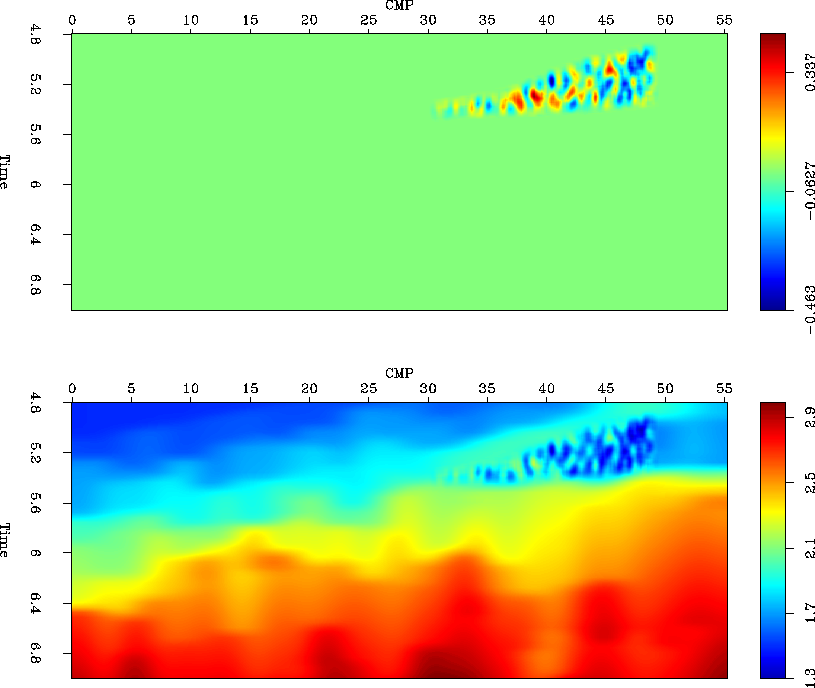
Figure 4 shows an example of the velocity perturbation associated with realization number 50, and the resulting velocity model.
 |
Using each modified velocity model, prestack wave-equation
migration Prucha et al. (1999) was applied to the data.
The resulting image is a function of the offset ray parameter phx, which
is related to the aperture angle ![]() , the dip
, the dip ![]() along the
in-line direction, and the velocity function
along the
in-line direction, and the velocity function ![]() ,as follows:
,as follows:
| |
(2) |
 |
In the migrated CMP gather, offset coherence and AVO attributes were calculated. The coherence measures allow us to discriminate good and bad velocity models: the higher the coherence measure, the better the velocity model.
To measure the coherence associated with each velocity model, semblance analysis was applied to the resulting migrated CMPs. Figure 6 shows the semblance panel for realization number 50. Two coherence measures were generated for each CMP, maximum semblance and delta velocity. Maximum semblance is calculated by picking the maximum semblance value in the semblance panel associated with each realization. Delta velocity is calculated as the difference between the velocity associated with the maximum semblance and the stacking velocity used for inverse normal moveout (NMO), as shown in Figure 7.
|
sem.50
Figure 6 The semblance panel for realization number 50 |  |
|
sem-graph.50
Figure 7 The semblance plot for CMPs at 46.9 to 47.1 km. For each curve, the maximum semblance measurement is the maximum value, and the delta velocity measurement is the difference between the velocity corresponding to the maximum semblance and the stacking velocity used for inverse NMO (1.5 km/s). | 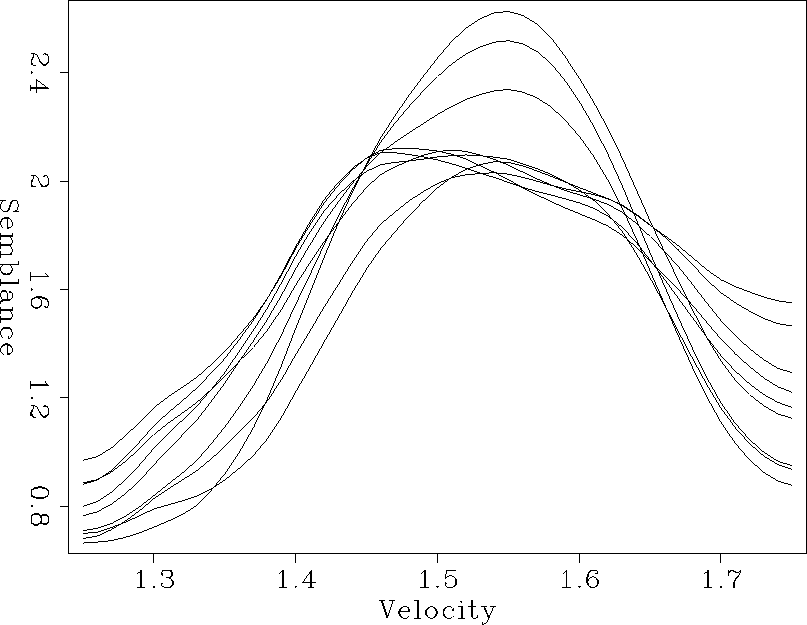 |
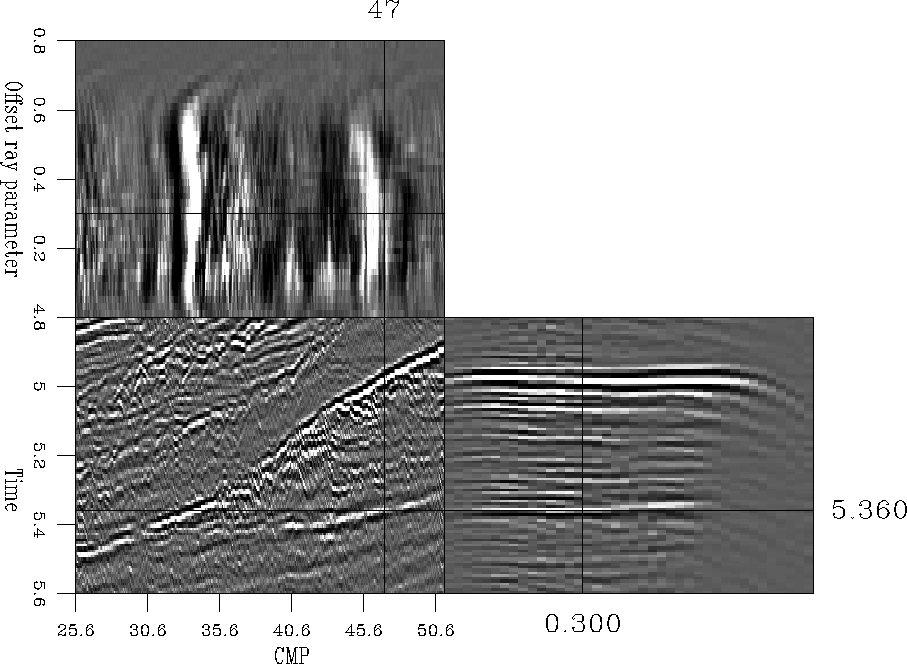
To analyze the reflectivity as a function of reflection angle (AVO analysis), we examined the CMP gathers in the offset ray parameter domain. As Figure 8 shows, in this domain the event of interest is not completely flat; there is some residual moveout in the event that affects the amplitude picking at the far offset.
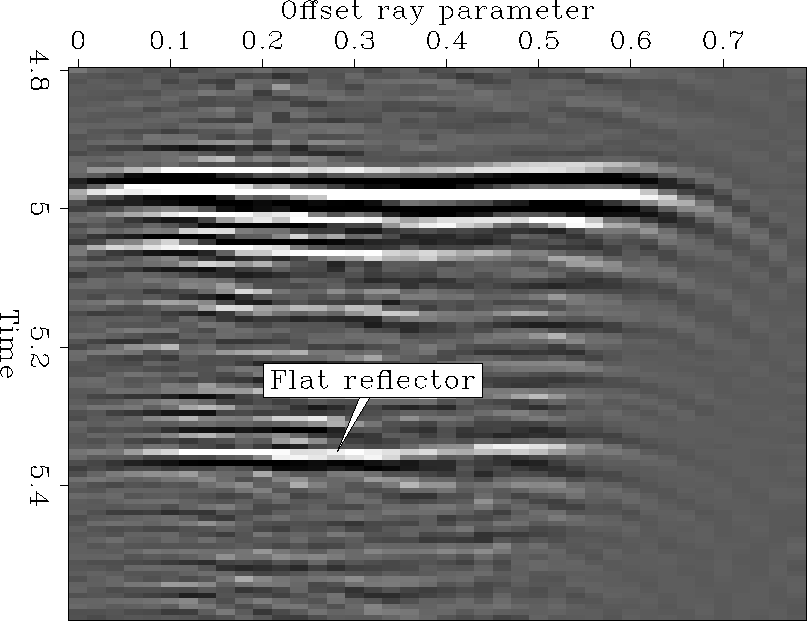 |
To correct for this problem, we applied a residual moveout correction, mute some traces at the near and far offsets, and picked the maximum amplitude value at the flat reflector considering a time window instead of the exact time of the reflector. Figure 9 shows the amplitude versus offset ray parameter curves for the 50 realizations on CMP at a distance of 47 km.
|
avo-47-r1-50
Figure 9 Amplitude versus offset ray parameter curves for the 50 realizations at a CMP gather at a distance of 47 km. The dashed lines show the range of offsets considered for the AVO analysis. | 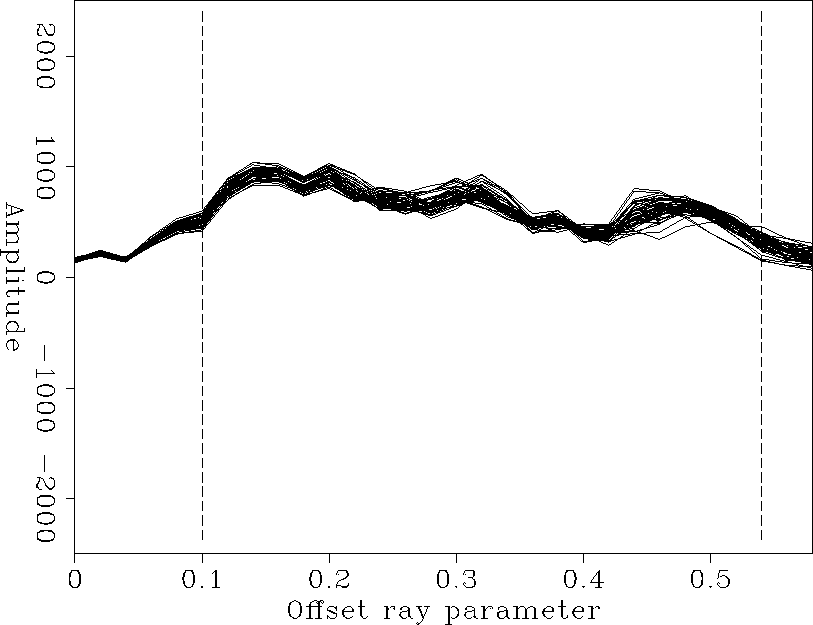 |
With these picked amplitudes, we calculated the attributes: intercept, gradient, and near - far offset stack. The intercept and gradient attributes are the zero crossing and slope of the best straight-line approximation (least-squares curve fitting) for the amplitude values. The near - far offset attribute is the difference between the stacking amplitudes at the near and far offset.
Because of the discontinuities along the flat reflector (see Figure 5) and to avoid tuning effects caused by the BSR reflector, we examined the results in some stronger parts of the reflector. We chose some CMPs around distance 47 km for the attribute versus coherence plots. The next section presents the resulting plots.