Next: Data regularization
Up: Inversion to common offset
Previous: Regularization of the inversion
This section presents the results of applying ICO to the shorncliff
3D land survey presented in the last chapter. The original dataset is
now further decimated to simulate
a sparse geometry that results into aliasing problems.
The shot lines from the over-sampled survey were spaced at 140 meters,
whereas in the decimated experiment they alternate between 280
and 420m for an average spacing of 350m.
I also extracted every fifth receiver line to simulate a cross-spread
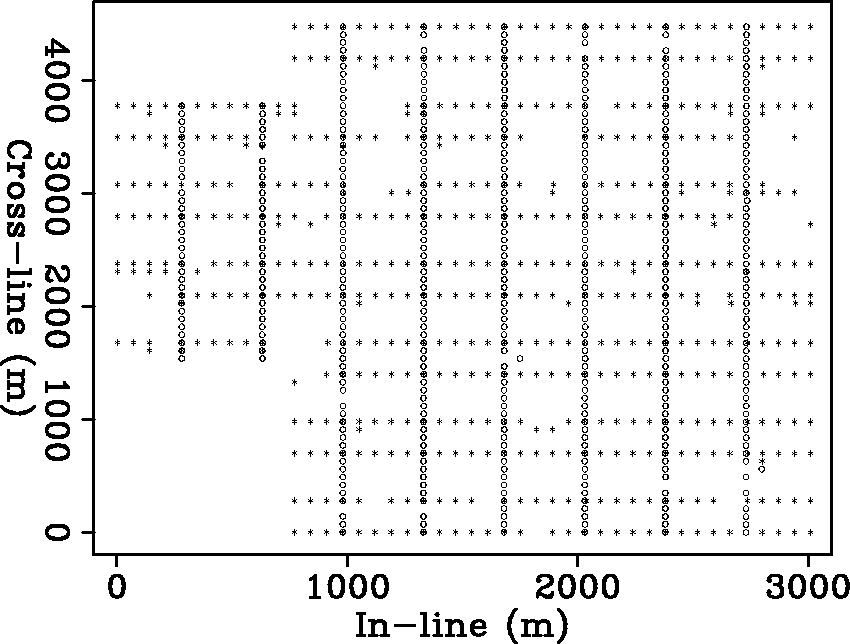
geometry with 350m line-spacing as shown in Figure survey350.
The 3D subset used in the simulations consisted of 8600 traces
whose source-receiver azimuth is between -60o
and 60o with an absolute-offset range from 500 to 900 meters.
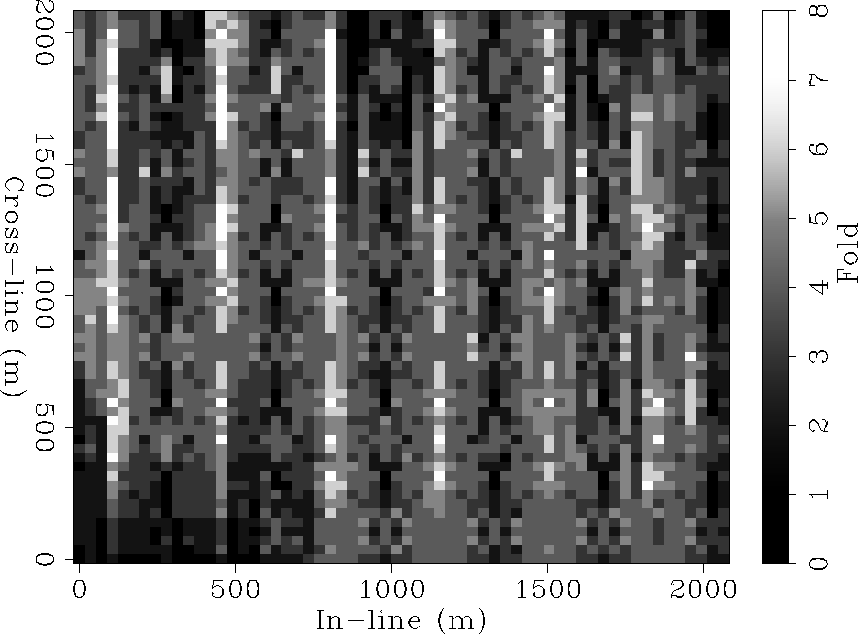
Figure fold35 shows the fold distribution for the subset
binned at the survey's nominal CMP spacing of 35 m.
The variations in coverage between different bins vary substantially
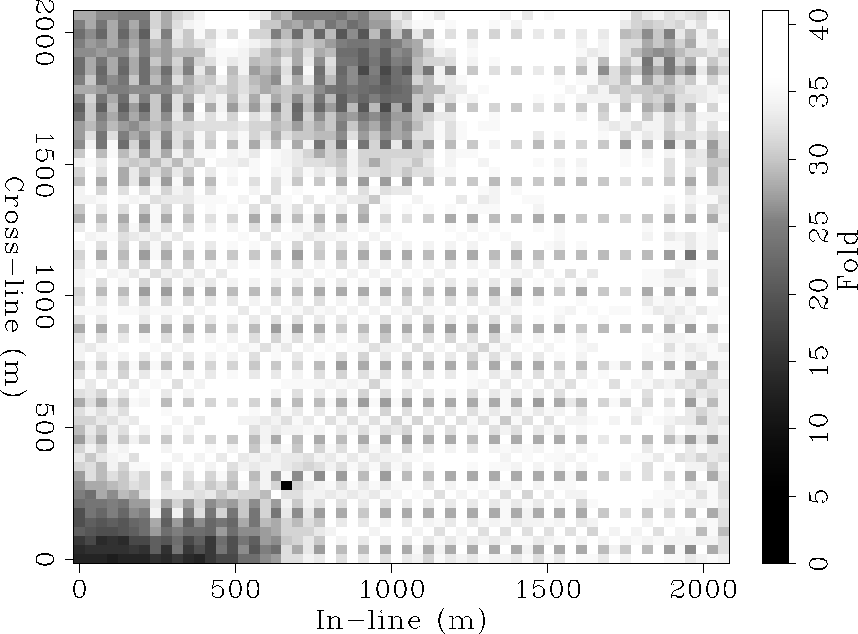
from 0 to a maximum of 6. Figure full-fold represents a fold chart
for the same offset and azimuth range from the original survey.
The densely-sampled subset is
13 times larger
than the decimated survey.
survey350
Figure 2 Source receiver layout for a decimated survey with cross-spread spacing of 350 m. The stars and circles indicate the source and receiver locations respectively.


 full-fold
Figure 3 Fold distribution of the oversampled survey for the 3D subset
fold35
Figure 4 Fold distribution for the decimated subset binned at the nominal CMP spacing.
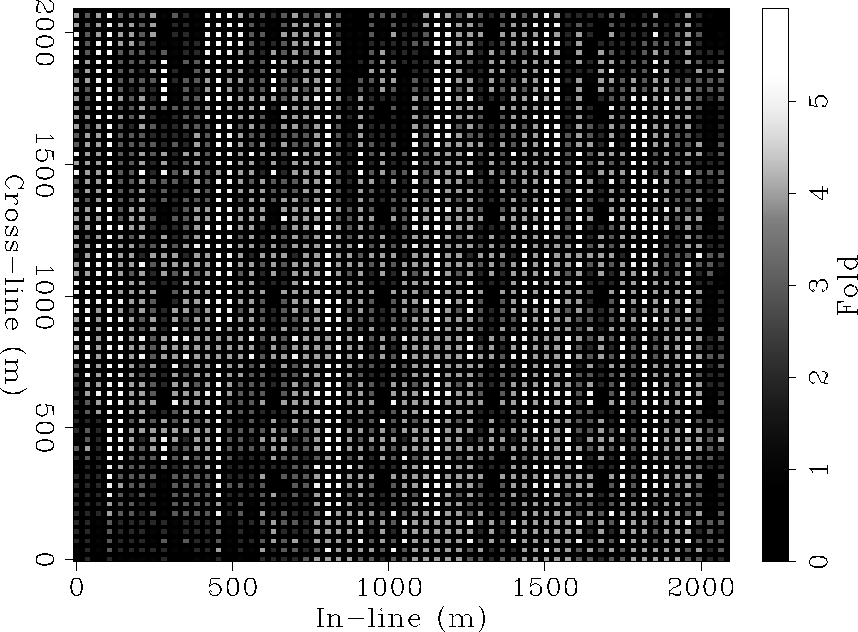
fold17
Figure 5 Fold distribution for the decimated subset binned at the model resolution.
Next: Data regularization
Up: Inversion to common offset
Previous: Regularization of the inversion
Stanford Exploration Project
1/18/2001