

Next: True-amplitude DMO
Up: Integral inverse DMO
Previous: Bleistein Born DMO and
Figures Spike and inv-dmo compare results of
different inverse DMO operators.
The left panel of Figure Spike is an in-line section
from a common offset cube consisting of
five unit-amplitude spikes. The offset is 800m and the CMP spacing is 20 m in
both directions. I compare the output of each true inverse
to the output of the adjoint Ronen (1987).
The ideal output would be five spikes with unit amplitudes. The table below
summarizes the output of each inverse DMO for increasingly deep spikes.
Spike
Figure 1 From left to right: input data, cascade of several DMO operators with their inverse.


| IDEAL Amp. |
Hale |
Black/Zhang |
Bleistein |
Ronen |
| 1.00 |
.76 |
.76 |
.76 |
.35 |
| 1.00 |
.95 |
.95 |
.95 |
.66 |
| 1.00 |
.97 |
.97 |
.97 |
.77 |
| 1.00 |
.97 |
.97 |
.97 |
.82 |
| 1.00 |
.98 |
.98 |
.98 |
.86 |
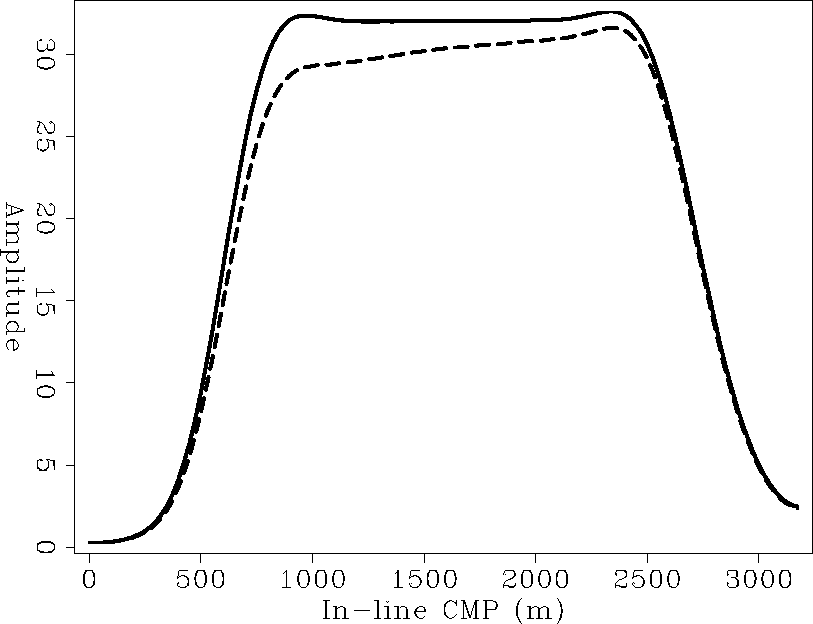
Figure inv-dmo represents a similar test for a synthetic model
consisting of a single bed dipping at 35 degrees angle.
The input data is a constant-offset section
recorded at an offset of 1600 m with CMP spacing of 25 m.
Each DMO operator is applied to the input section
to construct its zero-offset equivalent data. The zero-offset sections
are then back projected to the original offset of 1600 m using the
inverse DMO process.
The plot of peak amplitudes from the cascade of each DMO with its
asymptotic inverse coincides perfectly with the original amplitudes
from the constant-offset input section.
On the same
graph I also display the peak amplitudes from the cascade of DMO
with its adjoint.
The results of the adjoint clearly
fall below the theoretical values.
inv-dmo
Figure 2 Peak amplitudes along a dipping event from the cascade of several DMO operators and their inverse. The solid curve is the result of the adjoint inverse. The results of the asymptotic inverse for Hale, Zhang, and Bleistein operators coincide with original input amplitudes


 dmo
dmo
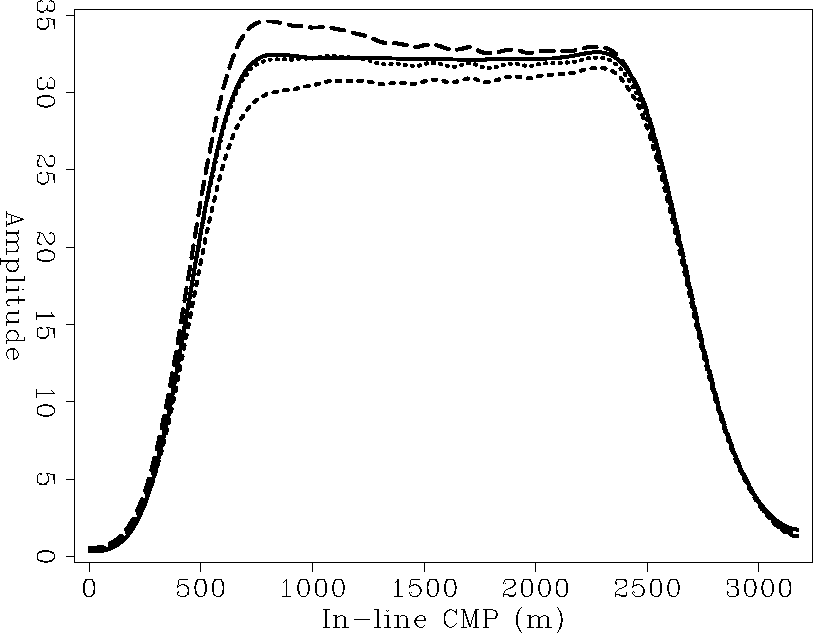
Figure 3 Peak amplitudes along a dipping event from a zero-offset section obtained by different DMO operators. The continuous curve is the the predicted result, the dashed curve is Hale's result, the dotted curve is Black/Zhang's output and the large dashed curve (top curve) is Bleistein's output


Next: True-amplitude DMO
Up: Integral inverse DMO
Previous: Bleistein Born DMO and
Stanford Exploration Project
1/18/2001


