 |
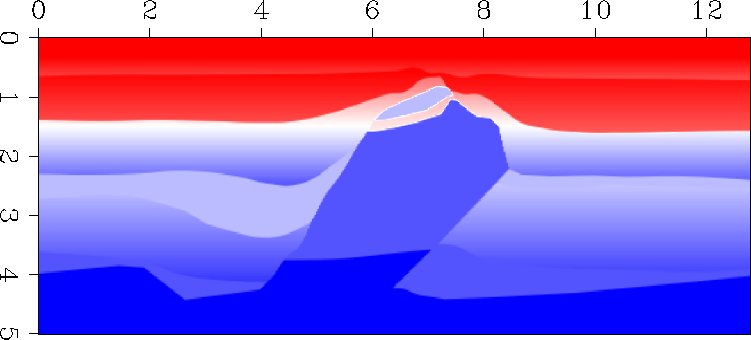
Figure 6 The Elf velocity model.
 |
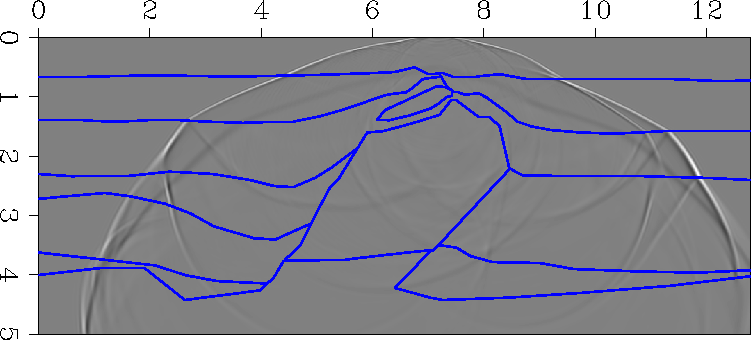
The first example compares the results of the traveltime computation with those of the full wave-equation modeling for the 2-D salt dome model shown in Figure 6. Figure 7 is a snapshot of the wavefield at 1.23 s, superimposed on an outline of the velocity model. Figure 8 shows, in addition, the wavefront corresponding to the same propagation time (1.23s), and some of the rays derived from the computed wavefronts.
 |
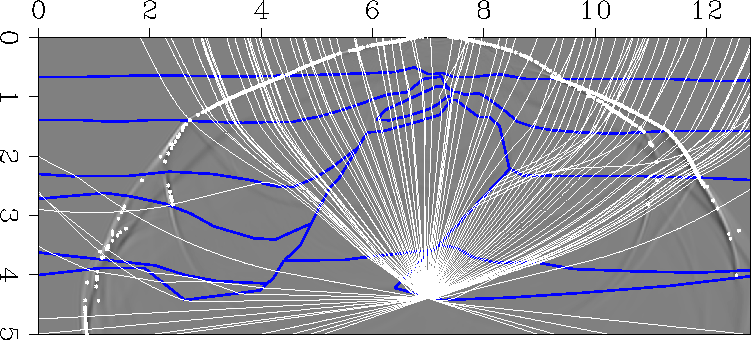 |
The first arrivals of the wavefronts superimpose well on the similar events in the wavefield. The later arrivals also superimpose well on the corresponding events in the wavefield, though the sampling is a lot sparser. This is understandable, since in HWT the wavefronts are sampled evenly in the ray domain, but not in the physical domain. Because sampling in the two domains is related, a better sampling in the ray domain can generate more accurate sampling in the physical domain. However, sampling is dependent on the model; there is no guarantee of more accurate sampling for rays shot with a smaller angle step. A better idea is to dynamically modify the sampling on the wavefronts as is done in some of the wavefront construction methods Vinje et al. (1993).
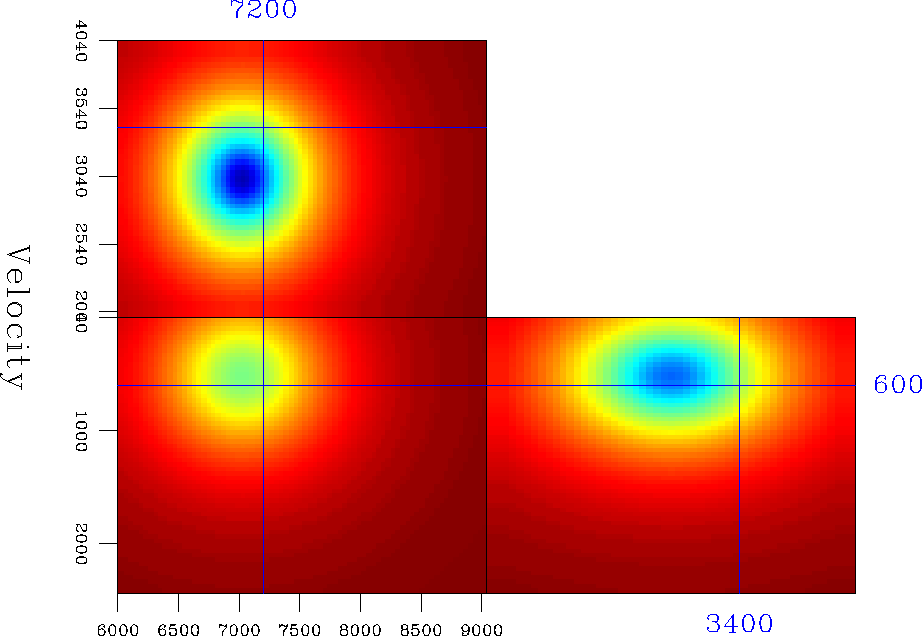
The next two examples are three-dimensional. In the first, I consider a strong negative Gaussian velocity anomaly of -2500 m/s placed in a constant velocity medium of 3000 m/s (Figure 9).
 |
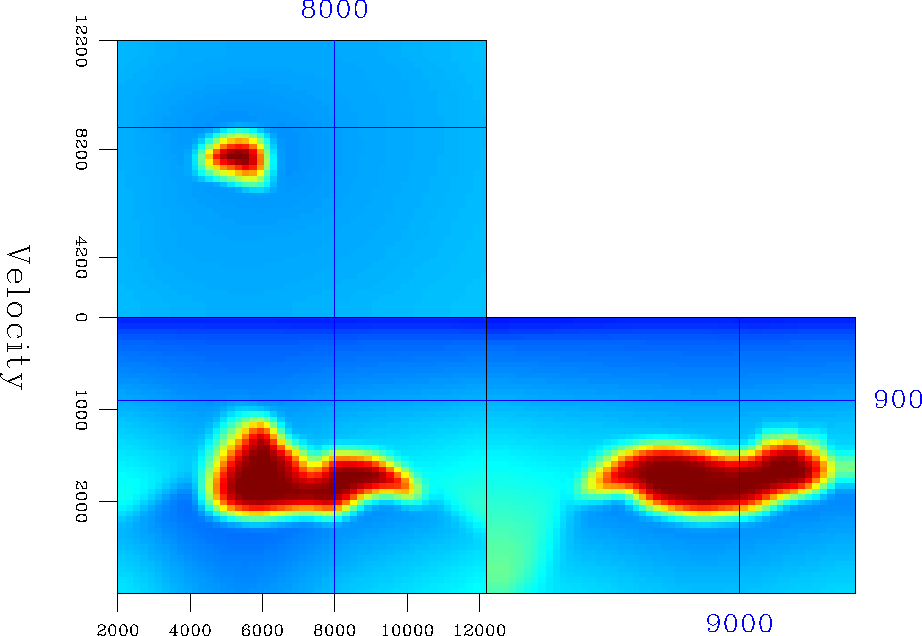 |
The source is placed on the surface above the center of the anomaly. Figure 11 depicts the traveltimes obtained by HWT and interpolated on the Cartesian grid using a multi-valued traveltime interpolation method Sava and Biondi (1997).
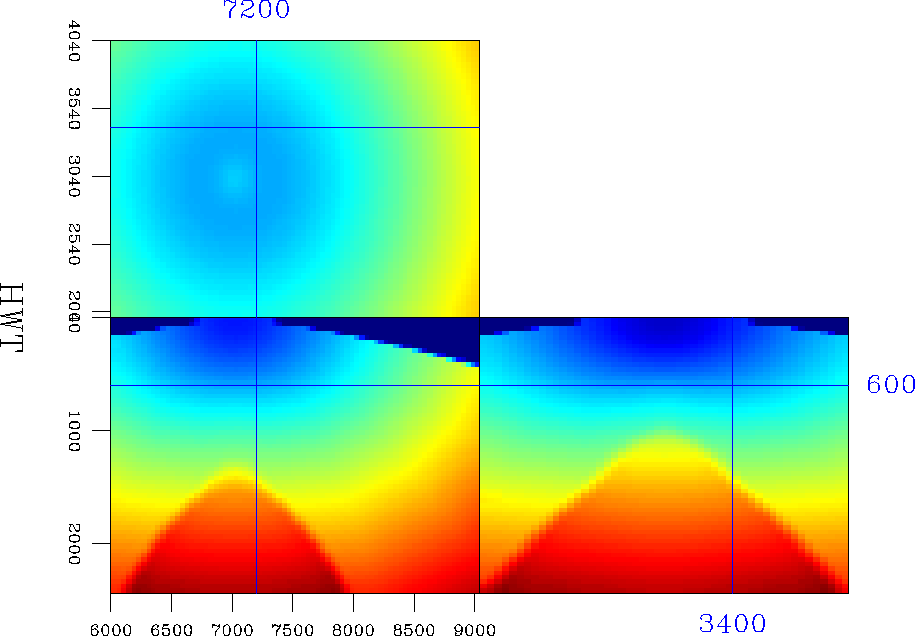 |
From the multiple values of the traveltime field, I have selected those that correspond to the minimum ray-length from the source Nichols et al. (1998). For comparison, Figure 12 indicates the first-arrival traveltimes of a fast marching eikonal solver (FME) Fomel (1997); Popovici and Sethian (1997).
 |
As expected, the traveltime cubes in Figures 11 and 12 match well for the regions that correspond to the first-arrival wavefronts. However, the traveltime cubes are completely different in the regions where the wavefronts triplicate, regions where the shortest ray does not correspond to the first arrival, but to a later one.
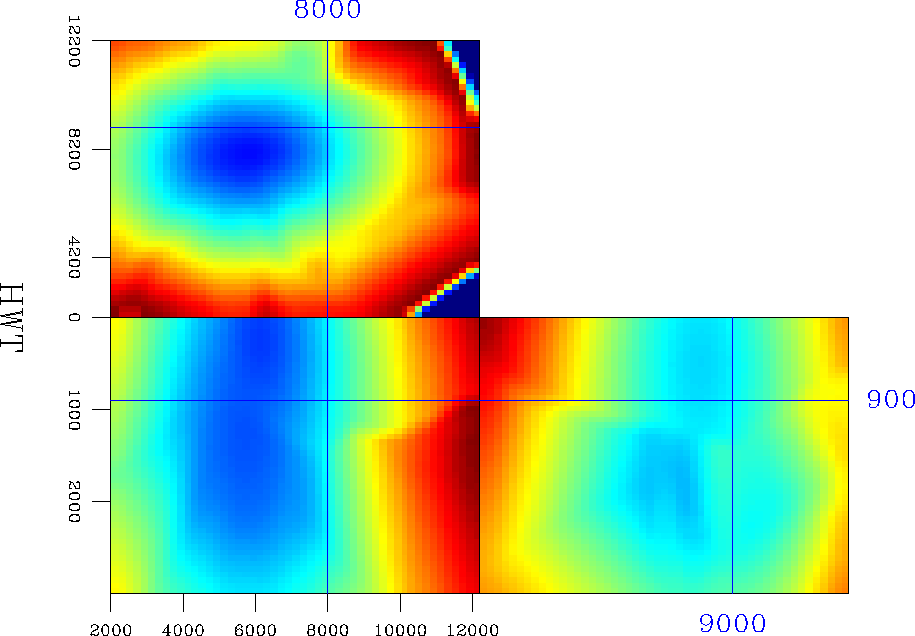
In the second 3-D example, I consider the SEG-EAGE salt model presented in Figure 10. Again, the HWT multiple-arrival traveltimes are interpolated on the Cartesian grid, and selected to have the minimum ray-length from the source, as we see in Figure 13.
 |
For comparison, the fast-marching eikonal results for the same source point and the same velocity model appear in Figure 14.
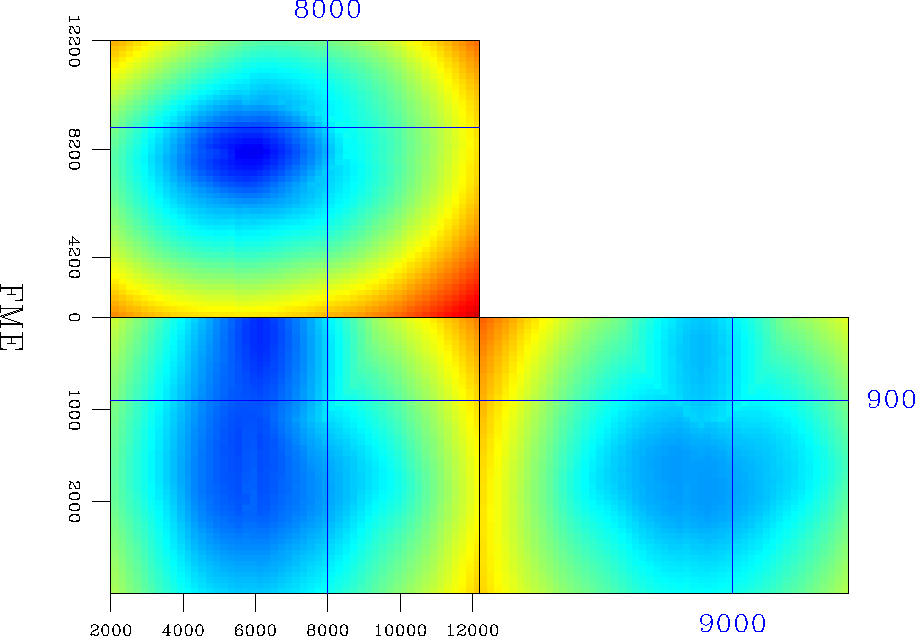 |
The HWT traveltimes for the volume above the salt body correspond to the direct arrival, while the FME traveltimes correspond to the head waves from the top of the salt.