Theoretically, the convolution of data (Nd points) and a PEF (Na coefficients)
estimated from the data is approximately uncorrelated in the limit
![]() : a spike at zero lag plus Gaussian, independent
identically distributed (iid) noise elsewhere.
Thus the spectrum of this residual error is approximately white.
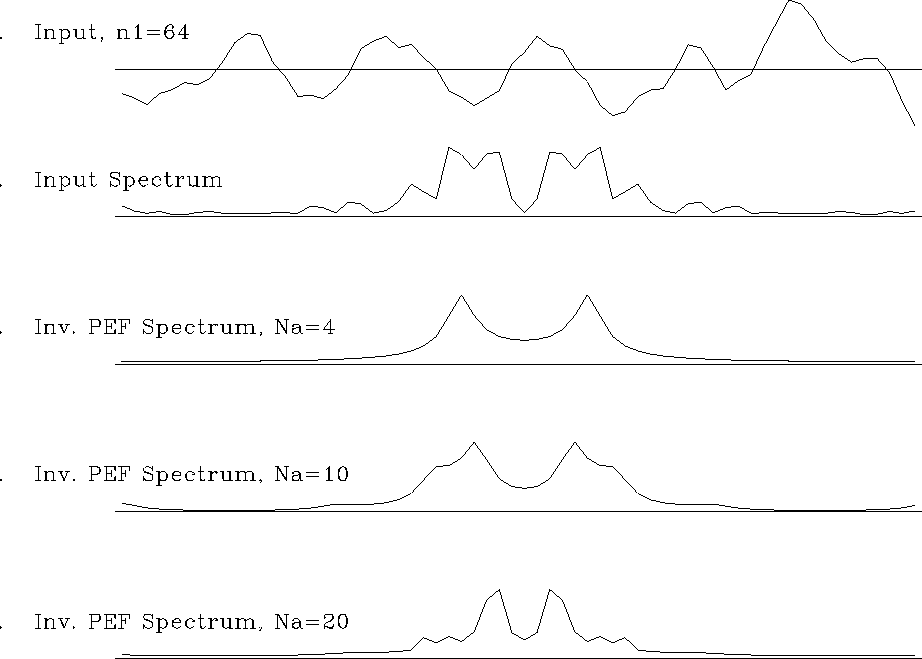
The frequency response of the ``inverse PEF'', as computed by deconvolution, is an
Na-point parameterization of the Nd-point inverse amplitude spectrum, as illustrated
in Figure 4. As the size of the filter increases, the parameterization
becomes more accurate, as expected from theory Claerbout (1976). The notion of PEF
as ``decorrelator'' is quite akin to decomposition by principal components
Castleman (1996),
where the number of principal components used in computation determines the degree of
decorrelation.
: a spike at zero lag plus Gaussian, independent
identically distributed (iid) noise elsewhere.
Thus the spectrum of this residual error is approximately white.
The frequency response of the ``inverse PEF'', as computed by deconvolution, is an
Na-point parameterization of the Nd-point inverse amplitude spectrum, as illustrated
in Figure 4. As the size of the filter increases, the parameterization
becomes more accurate, as expected from theory Claerbout (1976). The notion of PEF
as ``decorrelator'' is quite akin to decomposition by principal components
Castleman (1996),
where the number of principal components used in computation determines the degree of
decorrelation.
|
rand1d-spec
Figure 4 Frequency response of ``inverse PEF'' (deconvolution) as a function of filter size. As expected, as the filter length increases, the approximation improves. |  |
The following is an outline of the PEF-based texture synthesis method.
| |
(3) |
Generate a random residual r' with the same dimension as r. To create the synthetic texture, simply deconvolve r' by a:
| |
(4) |
Though the residual is uncorrelated, it does contain ``phase'' information.
Deconvolution of a random image blindly spreads scaled copies of the impulse response
of the inverse PEF across the output space.
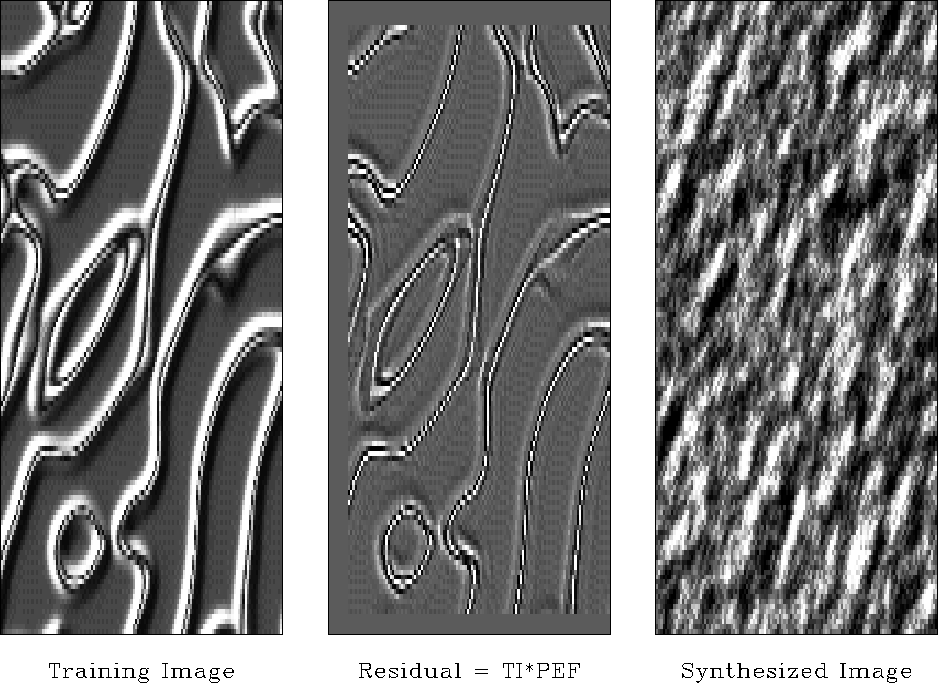
If the residual r is not sufficiently whitened, then
the replacement of r with r' will lead to an ineffective representation of
t by ![]() .
.
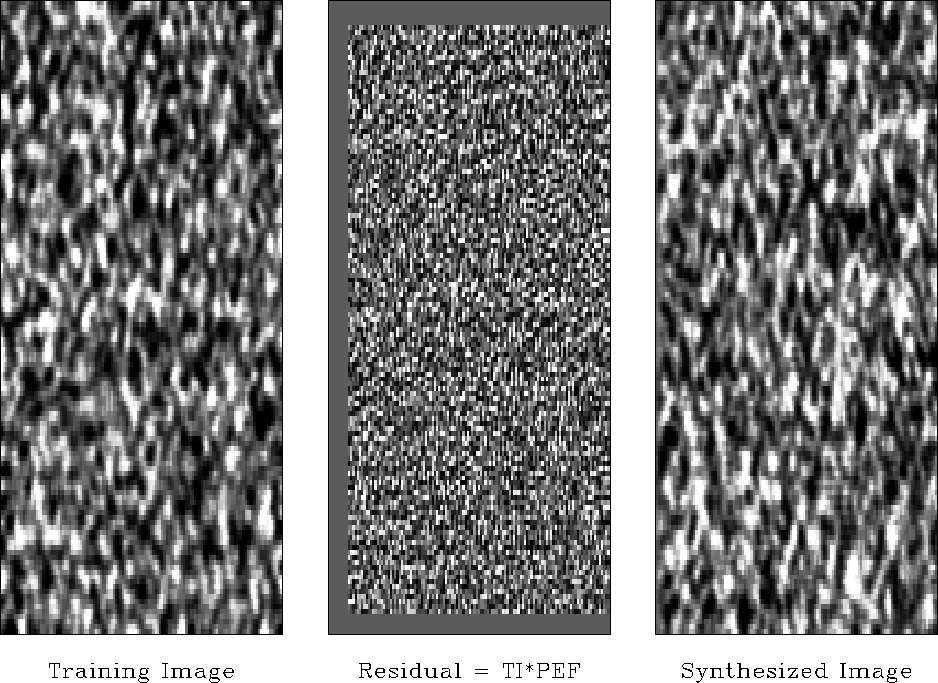
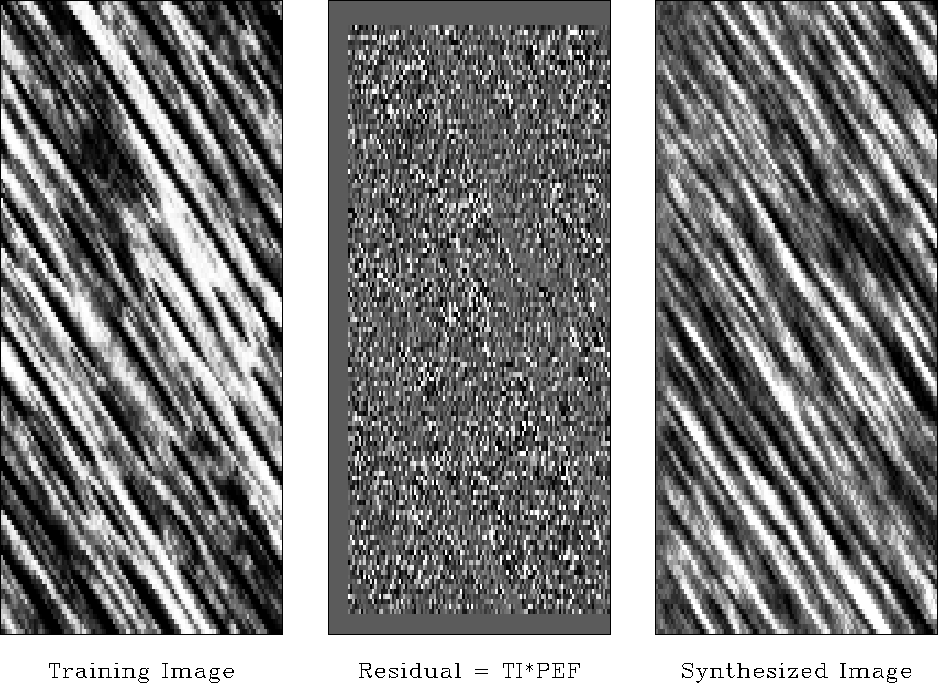
Figures 5 through 7 illustrate the
PEF-based texture synthesis process. The left-hand panel shows the training image,
the center panel shows the residual r = t*a, and the right-hand panel
shows the synthesized image, ![]() . A
10x10 PEF is used in each case. The blank areas in the residual panel correspond
to regions where the PEF falls outside the bounds of the known data.
. A
10x10 PEF is used in each case. The blank areas in the residual panel correspond
to regions where the PEF falls outside the bounds of the known data.
 |
 |
 |