|
|
|
|
Decon in the log domain - practical considerations |
Before applying deconvolution, it is useful to check which frequencies are in the data, as some frequencies may have been filtered out in preprocessing, or were simply not acquired. We also need to test if the notch is apparent in the data, as we expect the deconvolution to remove it. If the source and receivers are deep enough, we will be able to see the notch with the 4ms data we usually have. For the Baja dataset, the source and receivers were at a depth of about 9m, putting the theoretical notch frequency for zero offset at 83Hz, and therefore visible at the data's sampling rate of 4ms.
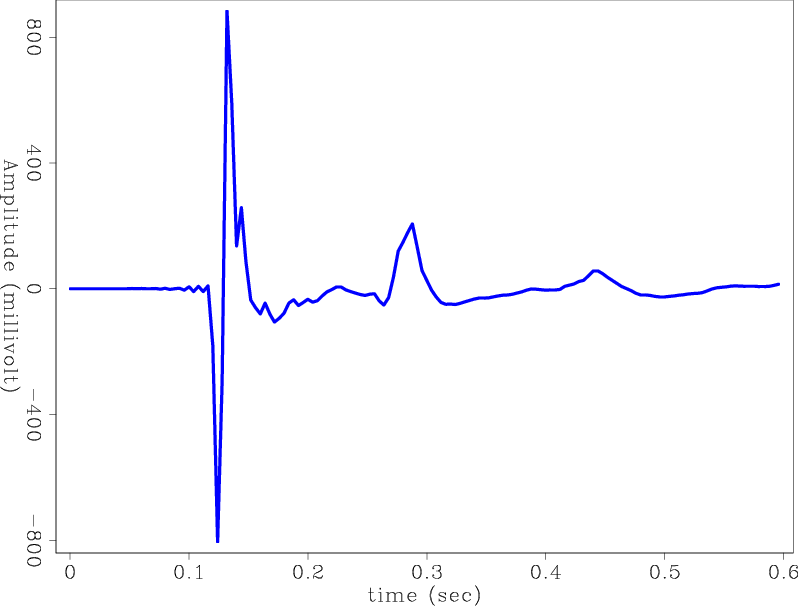
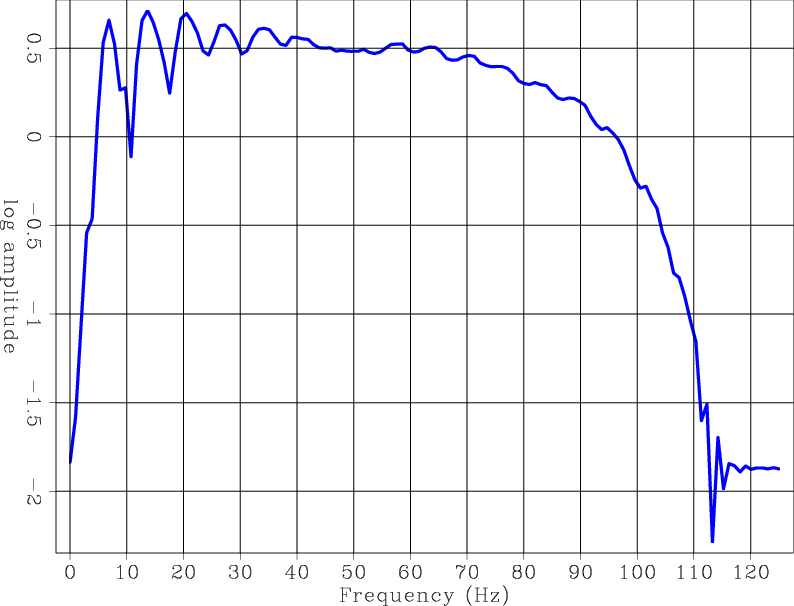
Figure 9(a) is part of a single near-offset trace, which contains the direct arrival and some of the bubble reverberations. There is no ``geology'' in the part of the recording, only the effective source signature. Figure 9(b) is the log of the frequency spectrum of this time series. We can see that the very low frequencies have either not been acquired or have been filtered. The bubble harmonics are apparent starting from 6.5Hz at intervals of about 6-7Hz. The source notch is apparent around 113Hz.
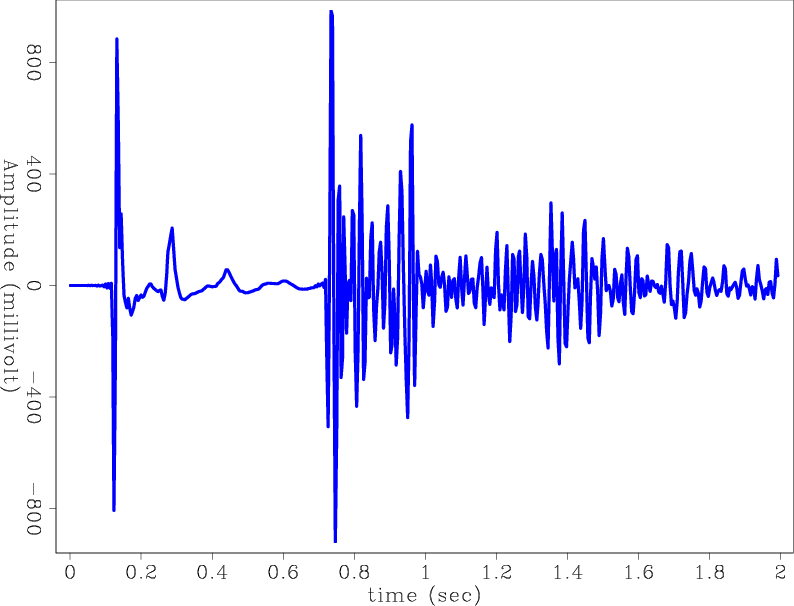
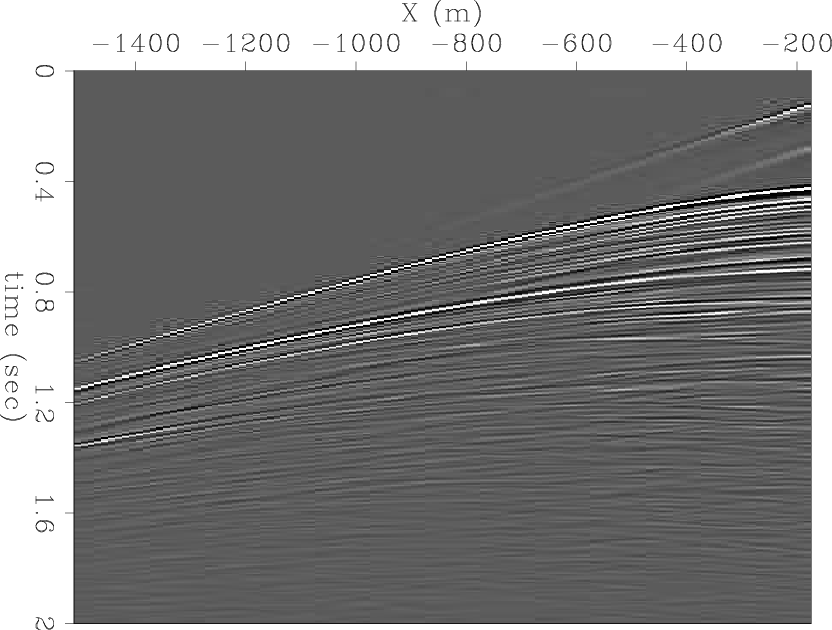
Figure 10(a) is the same near-offset trace with the addition of some reflection data. Figure 10(b) is the log spectrum of the entire trace. The notch now appears at around 103Hz. This notch is the result of the combined source and receiver ghosts, which have time delays pertaining to the receivers' and sources' depths in the water, and their offsets. Figures 11(a) and 11(b) are a single shot gather and its log spectrum. The notch starts from around 90Hz in the near offset, and increases in frequency with increasing offset, as illustrated by equation 4.
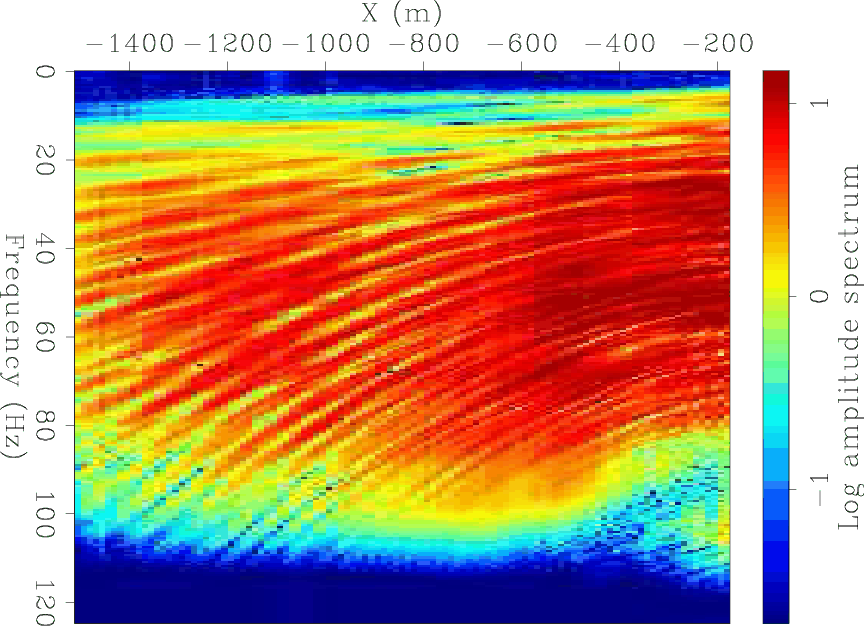
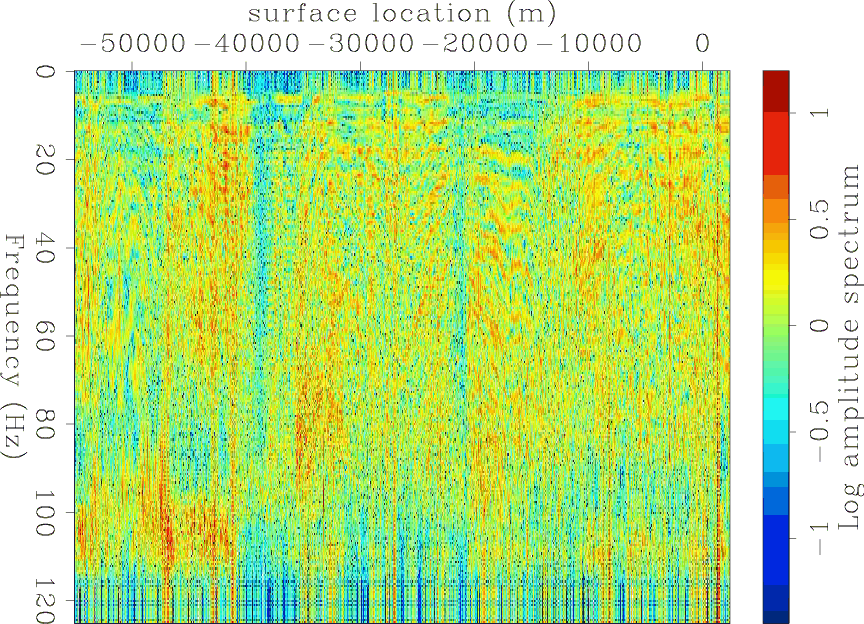
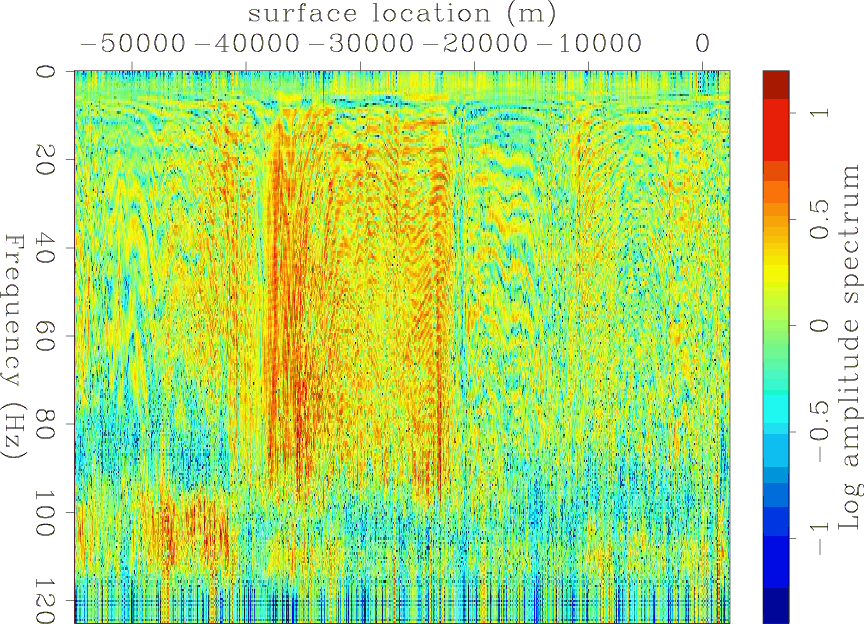
Figure 12(a) shows the log spectrum of the near-offset section shown in Figure 1. Especially apparent is how the frequency notch moves about the spectrum, from 90Hz to 110Hz. We interpret this as the result of the changing depths of the airgun and the receivers, as they are towed behind the acquisition vessel in the sea. Figure 12(b) is the log spectrum of the regularized gained input deconvolution result, and Figure 12(c) is that of the gained output deconvolution result.
These figures show some additional considerations which are useful for understanding the data, and can aid in evaluating the deconvolution results. In this case, we know that the inversion cannot work perfectly, since the lowest frequencies are not present. We also know that the notch is not at a constant frequency, and therefore the shot waveform is necessarily not constant along the entire near-offset section. We can also see that the deconvolution with the current regularizations is only mildly successful in removing the acquisition frequency notch.
|
|---|
|
EW05-bubble,EW05-bubblespec
Figure 9. One near offset trace. (a) Direct arrival and bubble. (b) Log of spectrum of direct arrival and bubble. |
|
|

|
|---|
|
EW05-notch,EW05-notchspec
Figure 10. One near offset trace. (a) Direct arrival, bubble and reflections. (b) Log of spectrum of direct arrival, bubble and reflections. |
|
|
|
|---|
|
EW05-shot992,EW05-ft
Figure 11. (a) Shot gather for shot at x=-62850 (b) Log of spectrum of shot gather, showing the notch frequency at around 90Hz at near offsets. |
|
|

|
|---|
|
spec-EW05s,spec-EW05s-t0-reg-6,spec-EW05s-t2-reg-6
Figure 12. (a) Log spectra of near offset section. (b) Log spectra of gained input decon. (c) Log spectra of gained output decon. Note the notch in (a) and how it changes frequency with surface location, which is a result of perturbations in the source and receiver depths as they are towed behind the vessel. The notch is better filled in (b), but it appears to be filled by some noise generated by the deconvolution itself, just as in Figure 8(e). |
|
|
|
|
|
|
Decon in the log domain - practical considerations |