|
|
|
|
Decon in the log domain - practical considerations |
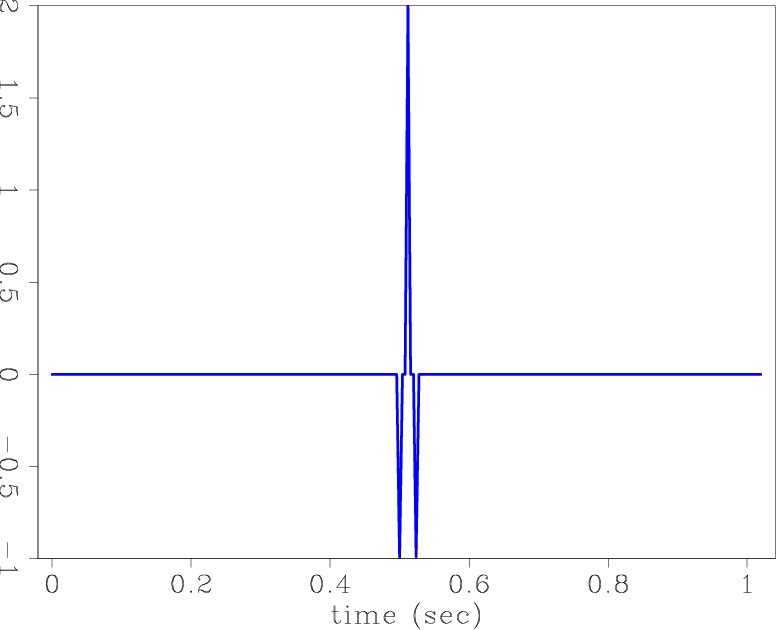
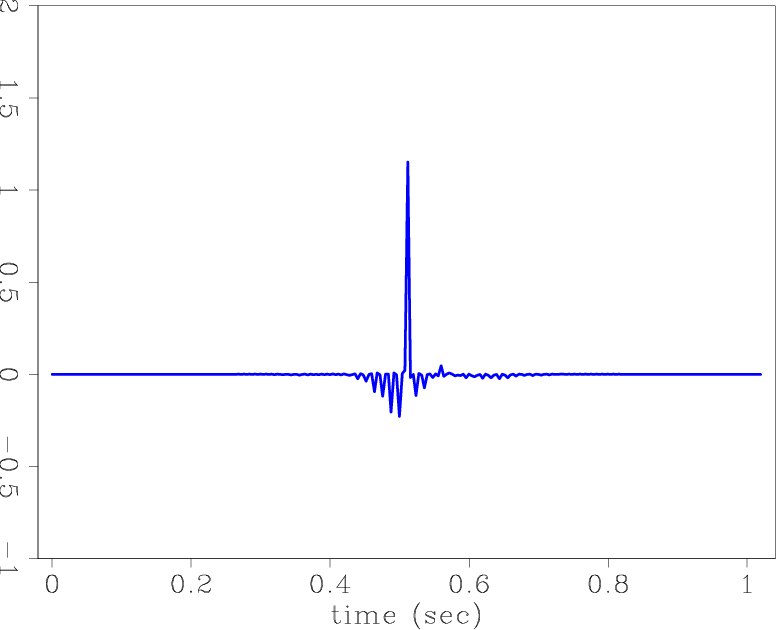
The frequency notch of marine data is an attribute of the acquisition system. We wish to test whether this deconvolution removes the frequency notch under ``perfect'' conditions. For this purpose, a synthetic wavelet was constructed of three spikes, so as to resemble a Ricker wavelet. The time difference between the lobes are such that they simulate a situation where the source and receivers were at a depth of 9m. The wavelet itself is nearly zero-phase, the spikes having the values
![$ [-1,2,-0.99]$](img29.png) .
.
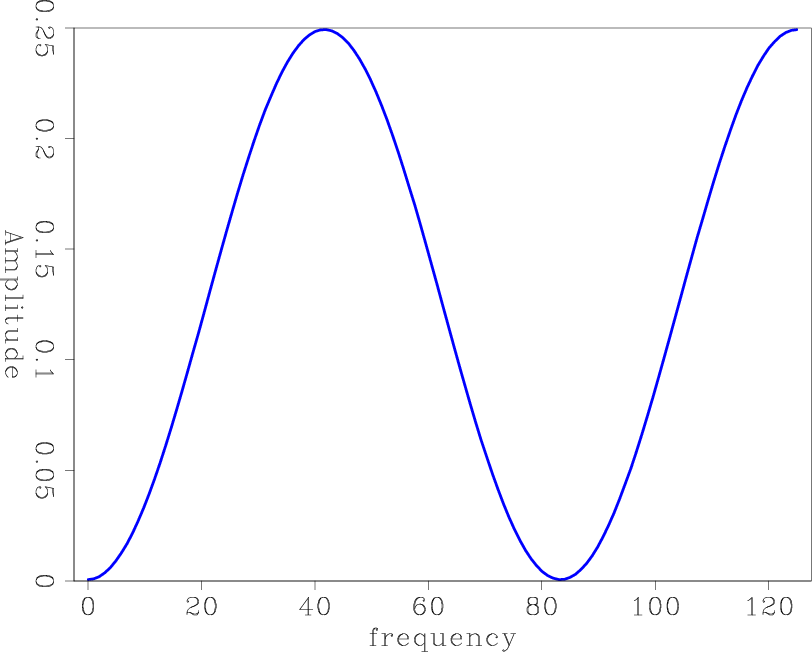
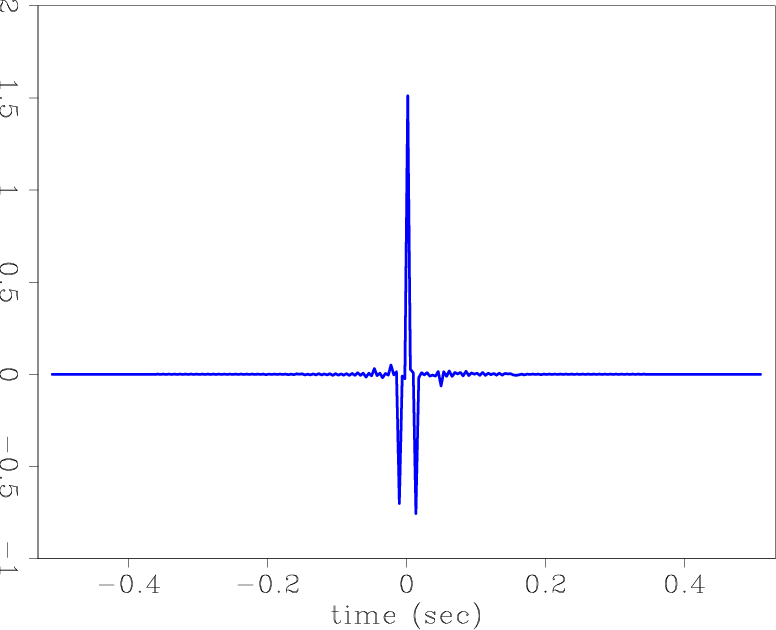
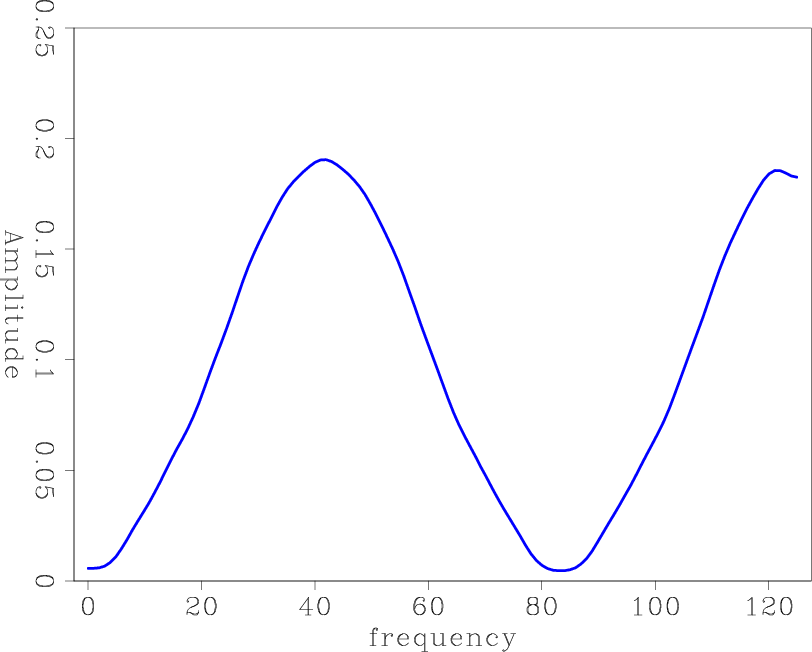
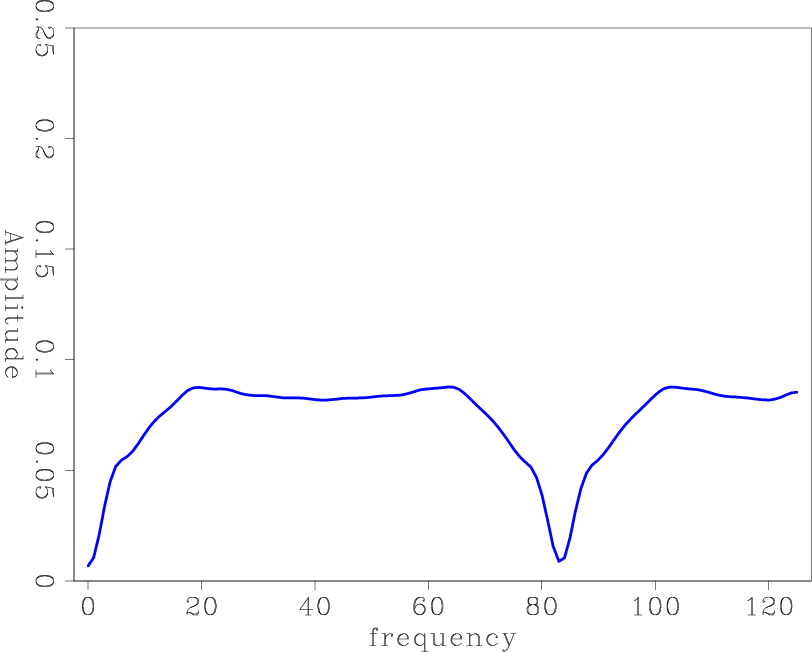
Figure 8(a) is the wavelet, and Figure 8(b) is its amplitude spectrum. The notch is at 83Hz. The regularized deconvolution was applied to this trace. In Figure 8(c) is the estimated shot waveform, and Figure 8(d) is its spectrum. The waveform resembles the synthetic trace, but its first negative lobe is slightly smaller than the second negative lobe, and it has small anti-causal and causal coefficients. Its spectrum is similar in shape, with the notch at the correct frequency. However it does not go to zero at the zero frequency, or at the notch frequency, as in the synthetic trace spectrum.
Figure 8(e) is the deconvolution result. Though the correct lobe has been spiked, there are strong precursors. It appears that the deconvolution has constructed some low frequencies that were absent from the data. In Figure 8(f) we can see that the notch frequency has not been filled as such, but rather that the other frequencies have been decreased so as to equalize the spectrum. The notch frequency of this waveform does not have zero energy, however.
|
|---|
|
synth-trace,spec-synth-trace,synth-t0,spec-synth-t0,deconsynth-t0,spec-deconsynth-t0
Figure 8. (a) Input trace. (b) Spectrum of input trace. Note the notch at zero and 83Hz (c) Estimated shot waveform from deconvolution. (d) Spectrum of estimated shot waveform. Note how the notch frequencies have some energy. (e) Deconvolved trace. The deconvolution has added some low frequency noise. (f) Spectrum of deconvolved trace. |
|
|
|
|
|
|
Decon in the log domain - practical considerations |