 |
 |
 |
 | Estimation of Q from surface-seismic reflection data in data space and image space |  |
![[pdf]](icons/pdf.png) |
Next: Wave-equation-based method
Up: Methods Review
Previous: Methods Review
In ray-based tomography, the process of wave propagation is described as a linear system, which assumes the relationship between the measurements and the inverse of Q is assumed to be linear. If the amplitude spectrum of an incident wave is  and the instrument/medium response is
  , the received amplitude spectrum
  may be expressed as
 |
(1) |
where the factor  includes geometrical spreading, instrument response, source/receiver coupling, radiation pattern, and reflection/transmission coefficients, and
  describes the attenuation effect on the amplitude.
Always,
is set to be constant over frequency, because these amplitude factors are frequency independent in the homogeneous media.
describes the attenuation effect on the amplitude.
Always,
is set to be constant over frequency, because these amplitude factors are frequency independent in the homogeneous media.
Based on this linear assumption, there are several ways of estimating the effective Q. The most popular way is the spectral ratio method. This method takes the logarithm of equation 1, which is shown as follows:
 |
(2) |
where
![$\displaystyle Y(f) = \ln \left[ {S(f)/R(f)} \right],$](img10.png) |
(3) |
 |
(4) |
 |
(5) |
 |
(6) |
It can be seen that the integrated attenuation  is the slope of the plot of
  versus frequency
  . This method may remove the effect of factor
  , when
does not depend on frequency
.
, when
does not depend on frequency
.
The other way of estimating Q is by central frequency shift, which is a statistics-based method that estimates the attenuation coefficient from the spectral centroid downshift over a range of frequencies. In most natural materials, seismic attenuation increases with frequency. The high-frequency components of the seismic signal are attenuated more rapidly than the low-frequency components. As a result, the centroid of the signal's spectrum experiences a downshift during propagation. Under the assumption of a frequency-independent Q model, this downshift is proportional to a path integral through the attenuation distribution and can be used as observed data to reconstruct the attenuation distribution tomographically. The relation between the downshift and the attenuation is mathematically shown as follows,
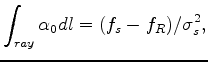 |
(7) |
where the central frequency is defined as
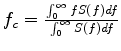 ,
,  is the central frequency of the input source,
  is the central frequency of the received signal, and
  is the variance of the source spectrum.
The advantage of these two methods is that they do not depend on amplitude scaling. However, they are not robust and will not work if the signal-to-noise ratio is poor. In addition, these two methods need a reference or source amplitude. Furthermore, since these methods are based on ray tomography, they share the limitations and assumptions of the ray-based method, which has a low computational cost but cannot handle complex structure.
|
|
|
|
| Estimation of Q from surface-seismic reflection data in data space and image space | |
|
Next: Wave-equation-based method
Up: Methods Review
Previous: Methods Review
2012-05-10