|
|
|
|
Single frequency 2D acoustic full waveform inversion |
 Hz wave field. The Gaussian shape has a standard deviation of
  m and an amplitude of 10% on a background velocity of
 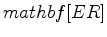 m/s (Figure 1).
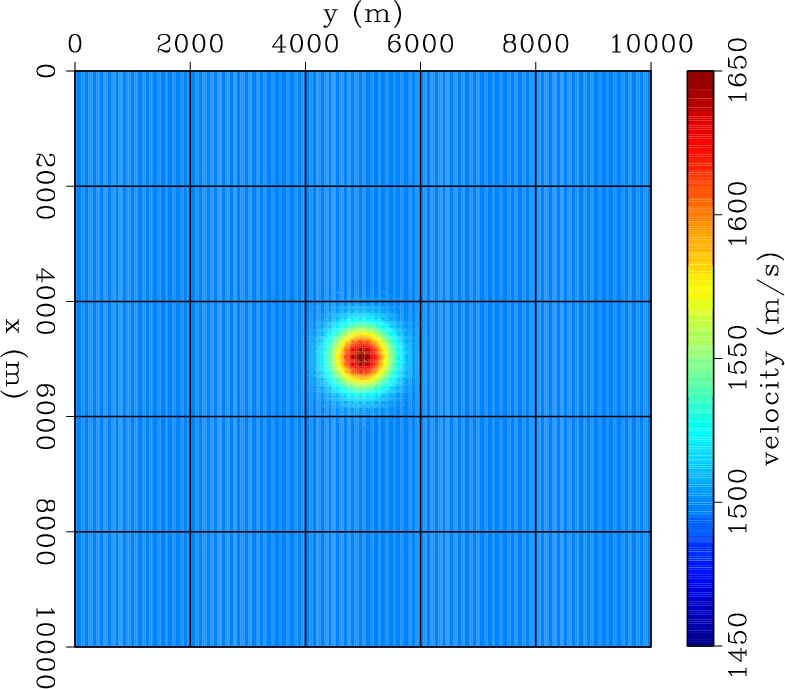
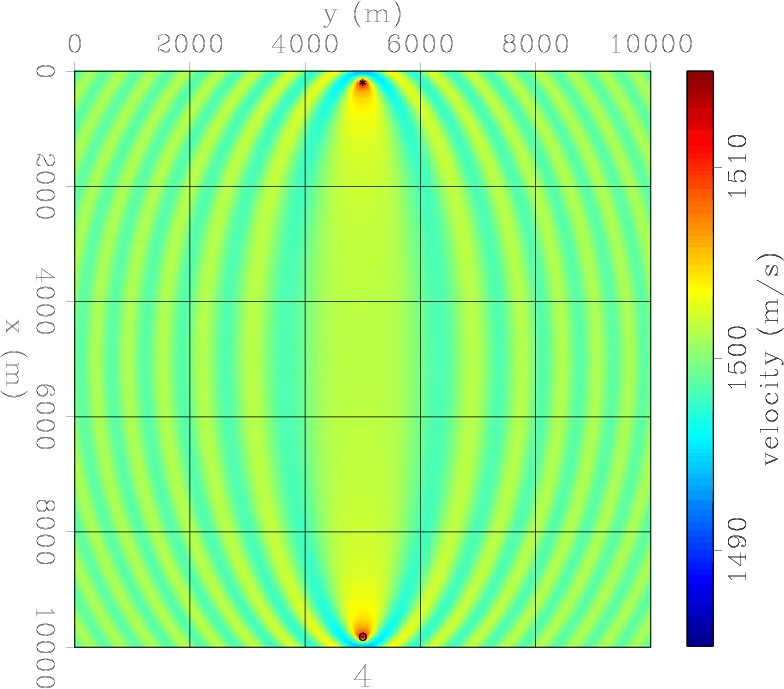
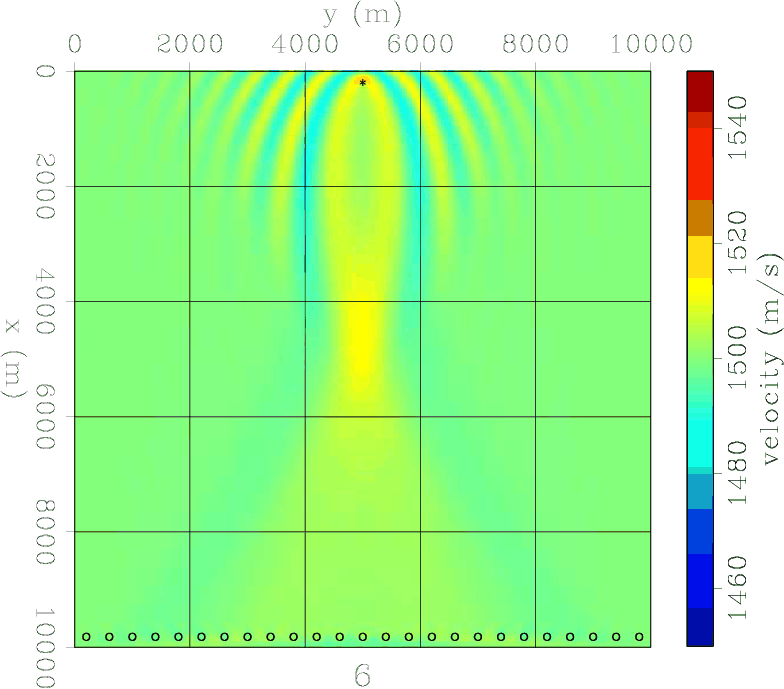
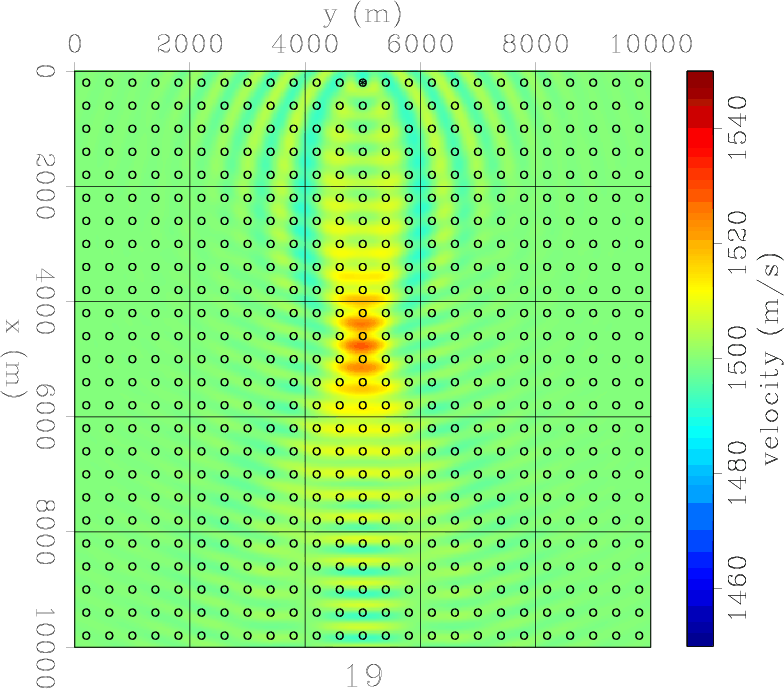
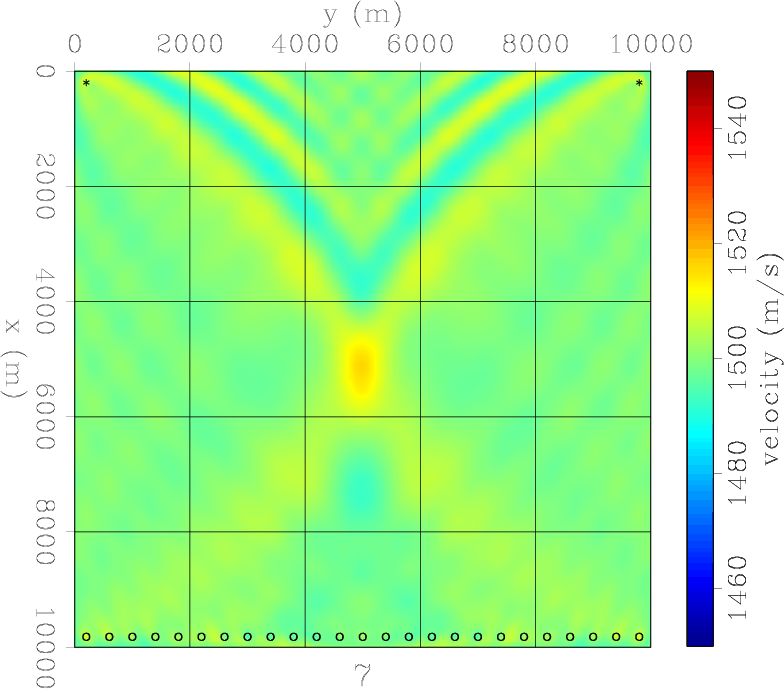
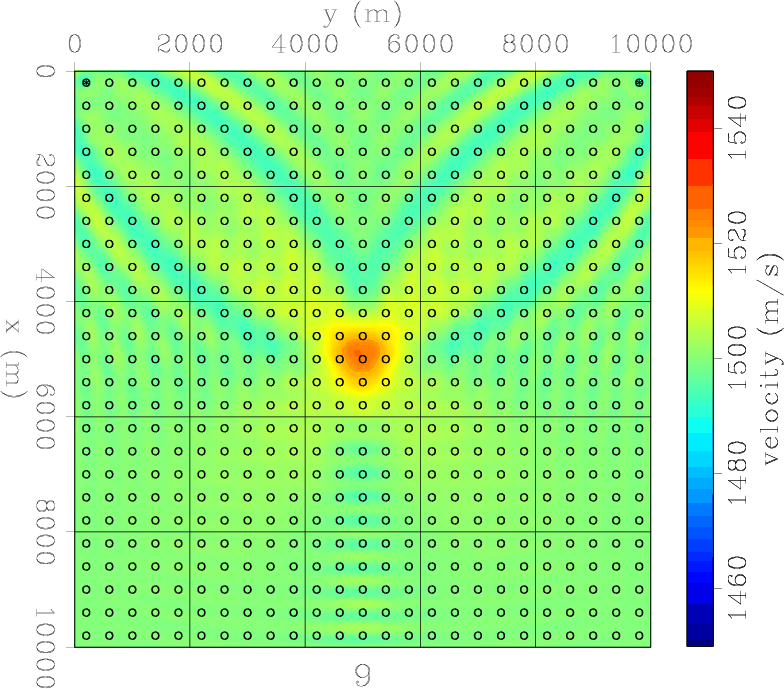
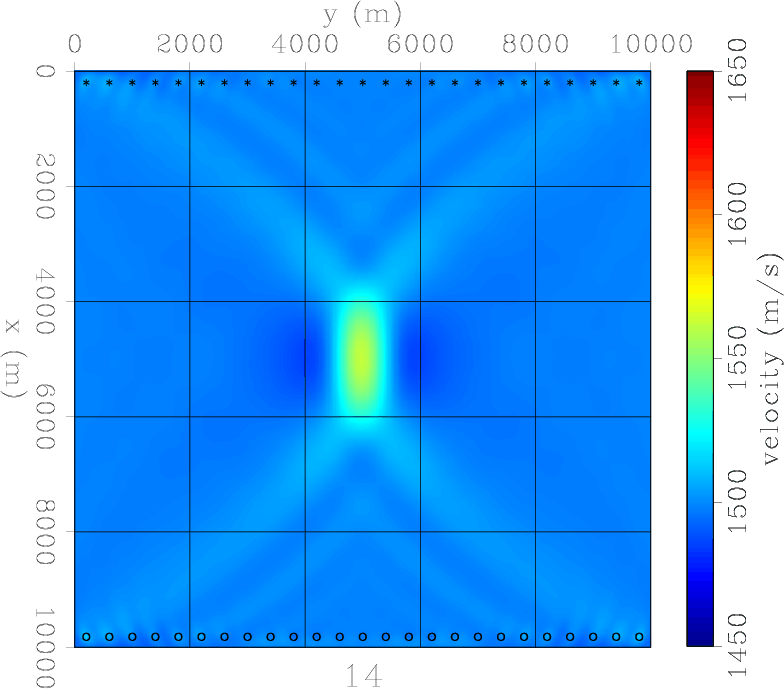
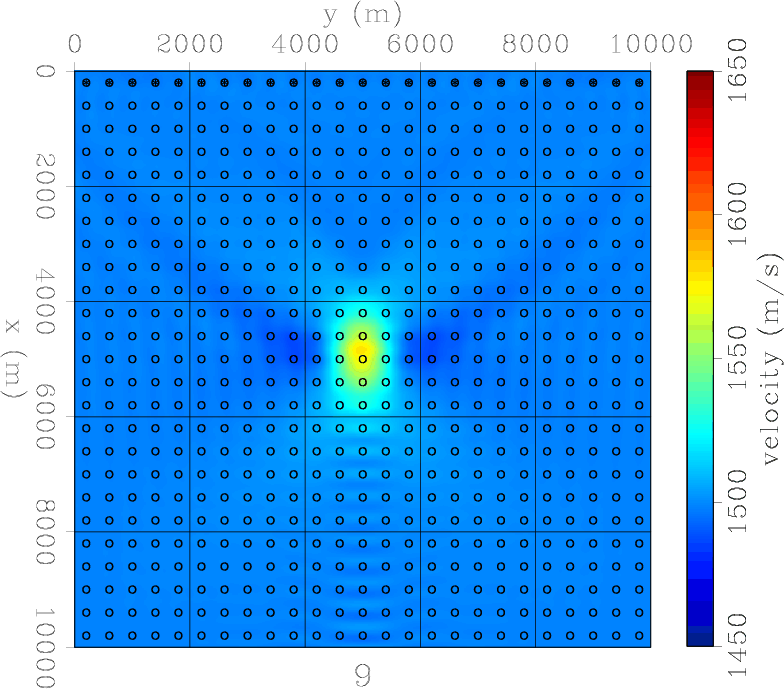
Having just one source and one receiver (Figure 2) severely limits the ability of the acquisition to retrieve a Gaussian anomaly. The final model, achieved after only 4 iterations, basically resembles the sensitivity kernel of one source-receiver couple. Using two receivers and one source (Figure 3) does not improve the situation much. The two sensitivity kernels now interfere, but together they still don't resemble the Gaussian anomaly we attempt to retrieve. A survey using a line of receivers and a single source starts to do better (Figure 4) but the range resolution is still quite poor. However, an acquisition with one source and a field of receivers suffers from a range interference of the outer side lobes between individual source-receiver sensitivity kernels (Figure 5). Two sources and a line of receivers (Figure 6 ) drastically improves the range resolution over just one source (Figure 4). And similarly for a field of receivers using just two sources (Figure 7). The next two experiments show the result of a line of sources. The first is essentially a conventional borehole geometry, where a line of sources and a line of receivers flank the target (Figure 8). This is capable of retrieving the the velocity anomaly in the cross-line direction reasonably well, but fails to resolve the Gaussian anomaly in the in-line direction. It actually retrieves negative values as big side lobes of the anomaly. This problem is only partially overcome when there is a field of available receivers (Figure 9). When sources and receivers encircle the anomaly, we achieve excellent retrieval (Figure 10) in just 5 iterations. However, retrieval is limited by the wavelength of the single frequency data.
|
true
Figure 1. True model. A Gaussian shaped anomaly, with a standard deviation of
m and an amplitude of 10 on a background velocity of
m/s.
on a background velocity of
m/s.
|
|
|---|---|
|
|
|
fwi1-itt4
Figure 2. Model 1: One source and one receiver. FWI converged after 4 iterations. A classical single frequency sensitivity kernel. |
|
|---|---|
|
|
|
fwi2-itt2
Figure 3. Model 2: One source and two receivers. FWI converged after 2 iterations. The two sensitivity kernels interfere, but together still do not resemble the Gaussian anomaly we attempt to retrieve. |
|
|---|---|
|
|
|
fwi3-itt6
Figure 4. Model 3: One source and a line of receivers. FWI converged after 6 iterations. Poor range resolution, but a velocity anomaly starts to appear in the right location. |
|
|---|---|
|
|
|
fwi4-itt19
Figure 5. Model 4: One source and a field of receivers. FWI converged after 19 iterations. Although the retrieved anomaly is located correctly, side lobes of individual sensitivity kernels interfere and dominate the result. |
|
|---|---|
|
|
|
fwi5-itt7
Figure 6. Model 5: Two sources and a line of receivers. FWI converged after 7 iterations. Two sources and a line of receivers drastically improve the range resolution over just one source. |
|
|---|---|
|
|
|
fwi6-itt9
Figure 7. Model 6: Two sources and a field of receivers. FWI converged after 9 iterations. The anomaly is very well shaped in space. |
|
|---|---|
|
|
|
fwi7-itt14
Figure 8. Model 7: A line of sources and a line of receivers. FWI converged after 14 iterations. The anomaly is poorly resolved in range, but there are very few side lobes. |
|
|---|---|
|
|
|
fwi8-itt9
Figure 9. Model 8: A line of sources and a field of receivers. FWI converged after 9 iterations. A field of receivers improves the range resolution. |
|
|---|---|
|
|
|
fwi9-itt5
Figure 10. Model 9: A square of sources and receivers. FWI converged after 5 iterations. The anomaly is nearly perfectly reconstructed and without signatures of the individual sensitivity curves. |

|
|---|---|
|
|
|
|
|
|
Single frequency 2D acoustic full waveform inversion |