|
|
|
|
P/S separation of OBS data by inversion in a homogeneous medium |
 ).
).
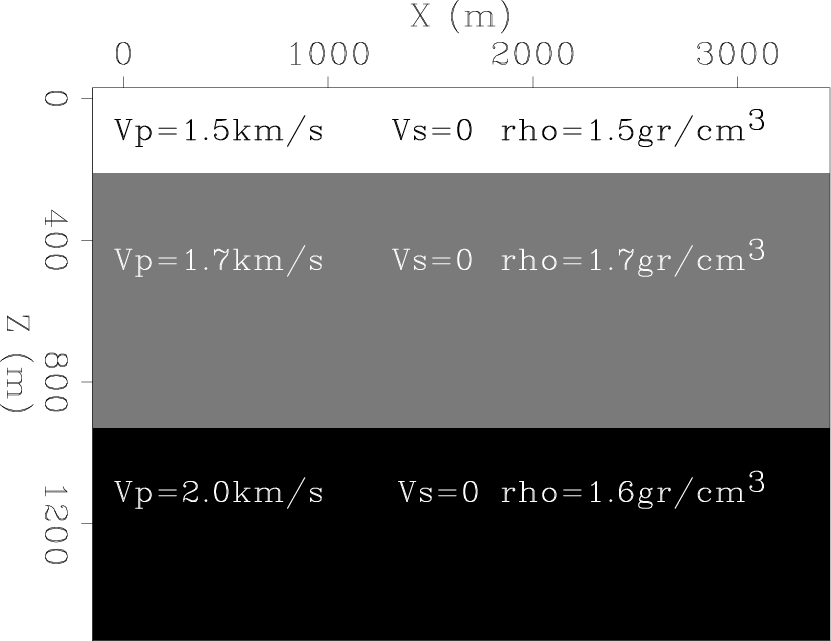
The medium parameters used for forward modeling are shown in Figure 12. The top layer is water. Shear velocity was set to zero everywhere. The source was a pressure source, located on the water surface, at the center of the model. The receivers were located at the top of the second layer, which represents sediment. The upper boundary was free, and the sides and bottom of the model had absorbing boundaries. The direct arrival was muted.
|
vp-obn-a
Figure 12. Medium parameters of synthetic OBS data. Shear velocity was zero everywhere. |
|
|---|---|
|
|
The inversion was run using the correct P-wave velocity and density (those of the sediment in which the receivers were placed), but also with shear-wave velocity set to
 . The virtual-sources were placed below the receivers, as shown in Figure 4.
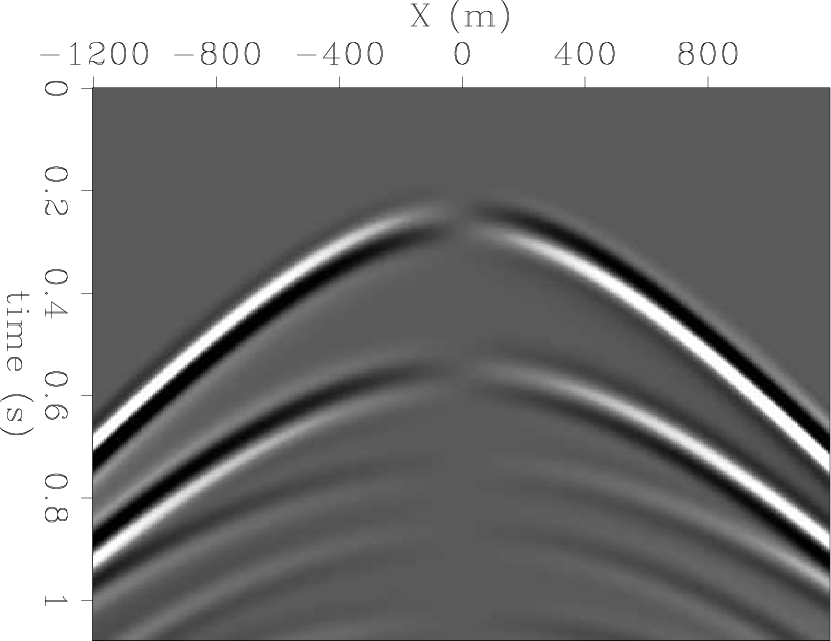
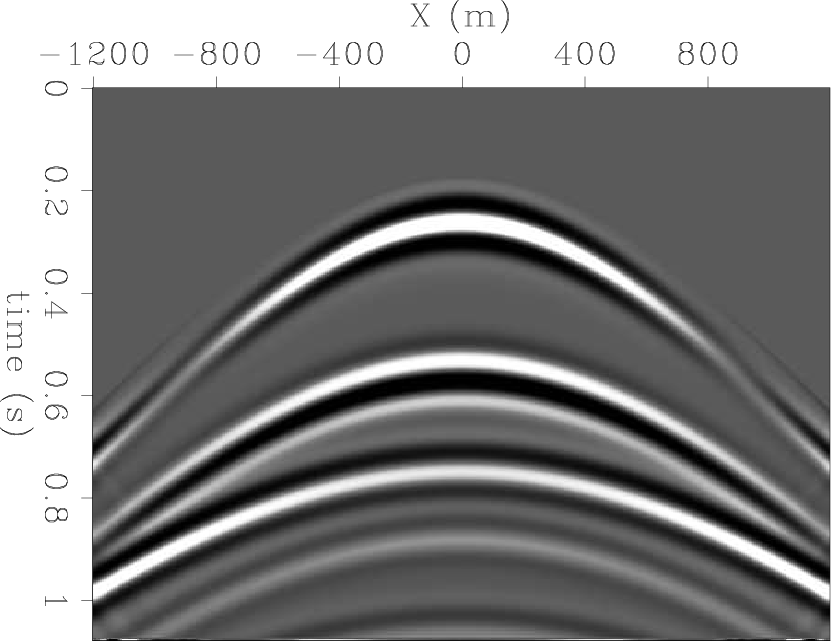
The synthetic vertical and horizontal displacement data are shown in Figures 13(a) and 13(b). Of the five events visible, the first, second, fourth and fifth arrivals are downgoing waves, reflected off the water surface. The only upgoing wave is the third arrival.
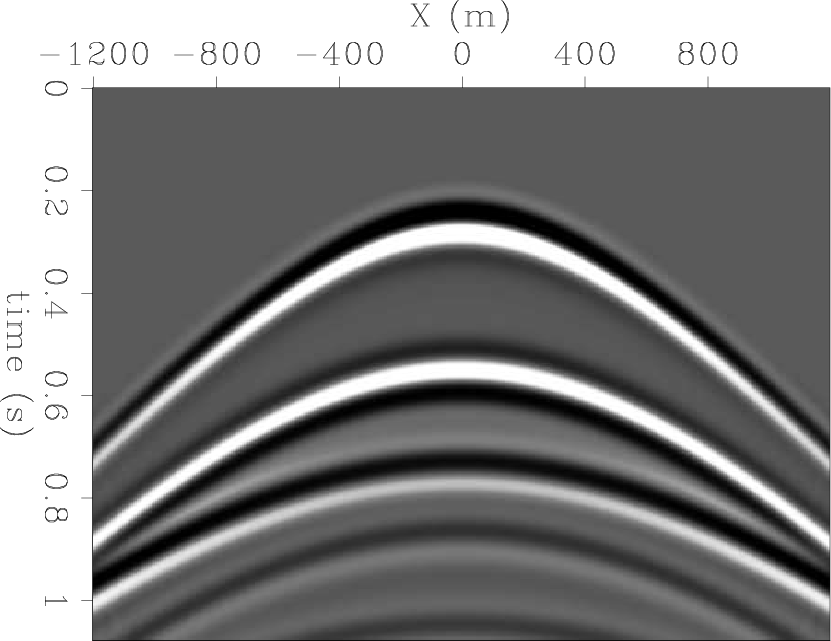
The reconstructed displacements are in Figures 13(c) and 13(d). These figures show that the objective function has indeed been minimized, and the displacement data have been matched.


|
|---|
|
ou1-0-a,ou1-1,ou1-2,ou1-3
Figure 13. Synthetic and reconstructed OBS data. (a) synthetic vertical displacement, (b) synthetic horizontal displacement, (c) reconstructed vertical displacement, (d) reconstructed horizontal displacement. |
|
|
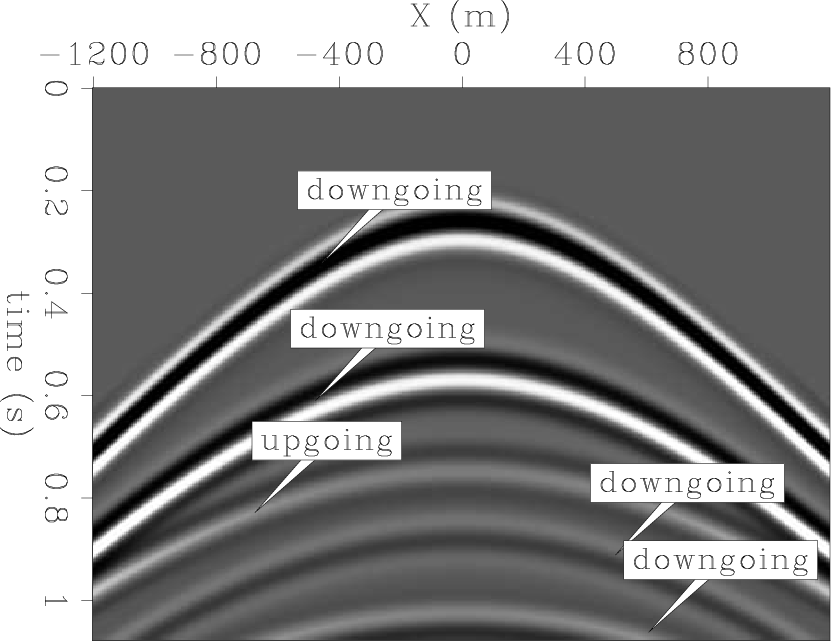
Figure 14(a) shows the P-wave recording, obtained by the Helmholtz separation operator applied to the synthetic displacement fields. Figure 14(b) is a validation that there are no S-waves present in the synthetic data. Figure 14(c) is the reconstructed P-waves calculated by the Helmholtz P-wave separation operator applied to the reconstructed displacements. Note that all the downgoing events have an opposite polarity compared to the synthetic P section, while the only P event that was reconstructed with the correct polarity is the upgoing arrival (the third arrival). The amplitude of the reconstructed third arrival is stronger than its amplitude in the synthetic P section.
Figure 14(d) is the Helmholtz S-wave separation operator applied to the reconstructed displacements. It shows that for every P arrival, a shear arrival was reconstructed as well, despite the fact that there were no shear waves in the synthetic wavefield.
The reason for the inaccuracy of the P and S-wave reconstruction in this case is that as a result of the virtual-sources being below the receivers, only upgoing waves could be modeled by the inversion. The inversion does generate a match to the displacement data, but the displacements are unconstrained above and below the receivers. Therefore the inversion is free to explain the downgoing P-waves as a combination of (incorrect) upgoing P-waves and upgoing S-waves. A graphical explanation of this feature is shown in Figure 15. The grey area represents the possible downgoing wave solutions which were not enabled by this inversion configuration. Instead, the incorrect upgoing wave modes (which still match the displacement data at the receivers and are therefore a possible solution) are used to explain the downgoing energy.

|
|---|
|
op1-0-a,op1-1,op1-2,op1-3
Figure 14. Synthetic and reconstructed OBS data. (a) synthetic P-wave, (b) synthetic S-wave, (c) reconstructed P-wave, (d) reconstructed S-wave. |
|
|
|
PS-sol-space
Figure 15. Representation of the solution space of the inversion. If the data contain both upgoing and downgoing waves, but the inversion is unable to reconstruct the downgoing waves, then incorrect P and S-waves will be used to match the observed geophone data. |

|
|---|---|
|
|
|
|
|
|
P/S separation of OBS data by inversion in a homogeneous medium |