|
|
|
|
Subsalt velocity analysis by target-oriented wavefield tomography: A 3-D field-data example |
The next step is to model a new data set for velocity analysis. The initial image and gathers (Figures 2 and 3) have been preprocessed before the modeling step, where we simply mute events inside the salt body. More sophisticated preprocessing, such as noise attenuation, key reflection selection, etc., can also be applied. The preprocessing step allows human interaction in the velocity analysis workflow, adding desired flexibility and control to this method.
We use 3-D plane-wave modeling to generate a Born data set at the top of the target region.
To determine the optimum parameters for the 3-D modeling, we carry out seismic visibility analysis (Jin and Xu, 2010),
which can provide us a quantitative estimate of which part of the data contributes most to the target region
for a given prestack acquisition geometry.
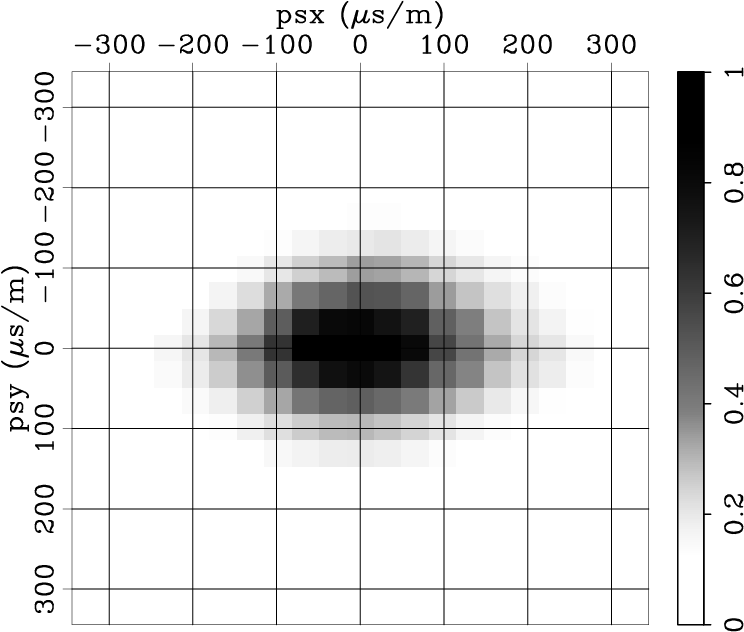
Figure 4 shows the average source visibility map for the dominant frequency ![]() Hz, as a function of both
inline and crossline ray parameters. Note that most of the energy contributing
to the target region falls within the range where
Hz, as a function of both
inline and crossline ray parameters. Note that most of the energy contributing
to the target region falls within the range where
![]()
![]() , and
, and
![]()
![]() .
.
Based on the result of visibility analysis, we modeled ![]() plane waves at the
top of the target region, with
plane waves at the
top of the target region, with ![]() plane waves inline and
plane waves inline and ![]() plane waves crossline.
The minimum and maximum dip and azimuth angles of these plane waves are
approximately
plane waves crossline.
The minimum and maximum dip and azimuth angles of these plane waves are
approximately ![]() and
and ![]() ,
, ![]() and
and ![]() , respectively.
The dominant frequency used for the
generalized Born wavefield modeling is
, respectively.
The dominant frequency used for the
generalized Born wavefield modeling is ![]() Hz.
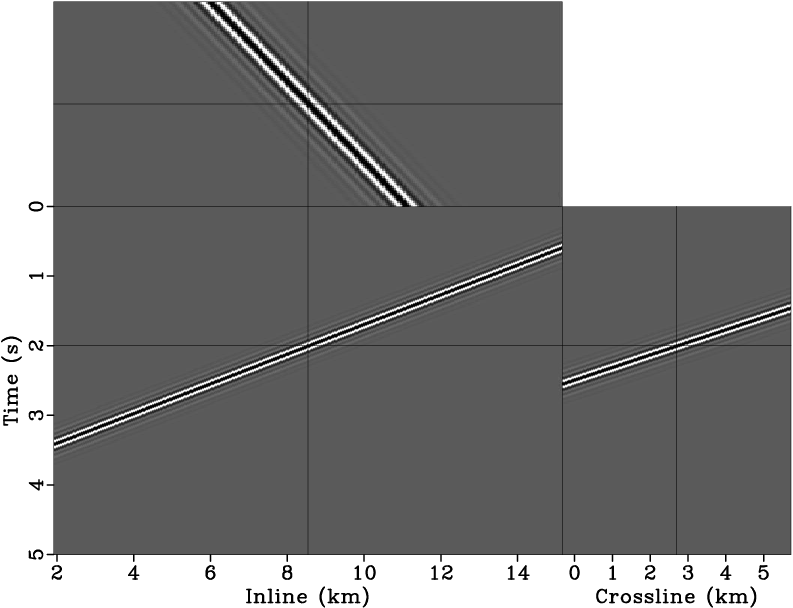
Figure 5 shows a
3-D plane-wave source function with both incident dip and azimuth angles equal to
Hz.
Figure 5 shows a
3-D plane-wave source function with both incident dip and azimuth angles equal to ![]() , shooting from the top of
the target region (Figure 1),
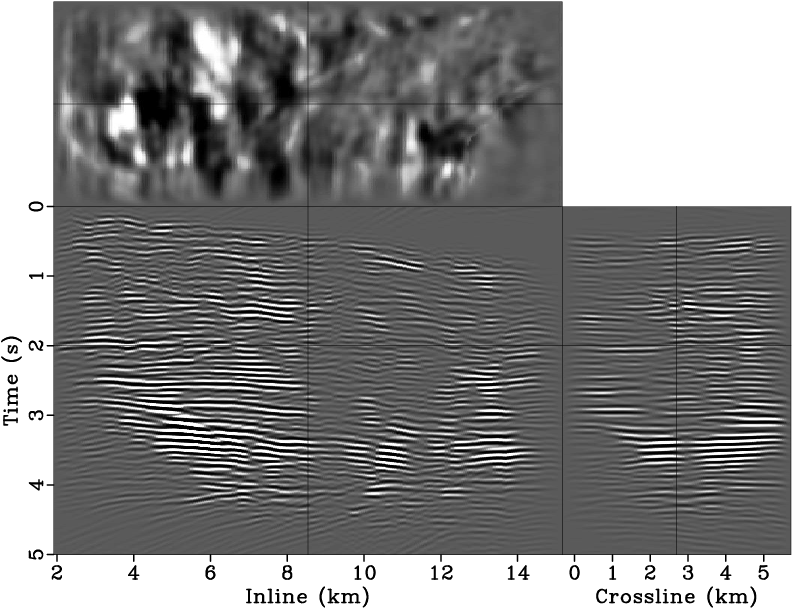
and the corresponding
3-D plane-wave gather collected at the top of the target region.
, shooting from the top of
the target region (Figure 1),
and the corresponding
3-D plane-wave gather collected at the top of the target region.
|
bpgom3d-born-visi
Figure 4. The average source visibility (data-domain illumination) for the target region using 3-D plane-wave acquisition geometry for the Born wavefield modeling. Note that most of the energy contributing to the target region falls within the range where |
|
|---|---|
|
|
|
|---|
|
bpgom3d-born-tsou,bpgom3d-born-trec
Figure 5. The synthesized 3-D plane-wave data. Panel (a) is the plane-wave source function with both incident dip and azimuth angles equal |
|
|
|
|
|
|
Subsalt velocity analysis by target-oriented wavefield tomography: A 3-D field-data example |