|
|
|
|
Residual-moveout analysis in presence of strong lateral velocity anomalies |
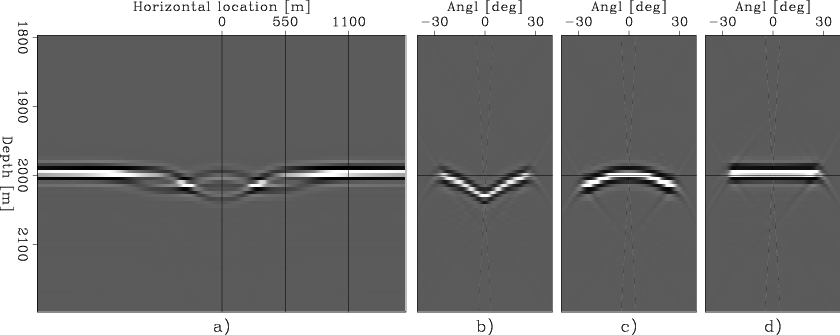
The one-parameter residual-moveout analysis conducted on this image is based on approximating the vertical shifts as being directly proportional to the square of the tangent of the aperture angle (Biondi and Symes, 2004). The ADCIG shown in Figure 3b obviously does not fulfill this approximation because the velocity error is quickly changing along the horizontal direction. Furthermore, because the cumulative kinematic error caused by the anomaly is large, the moveout at wide angles in the ADCIG shown in Figure 3c is sufficiently large to cause cycle-skip problems even when using a supposedly robust one-parameter moveout analysis.
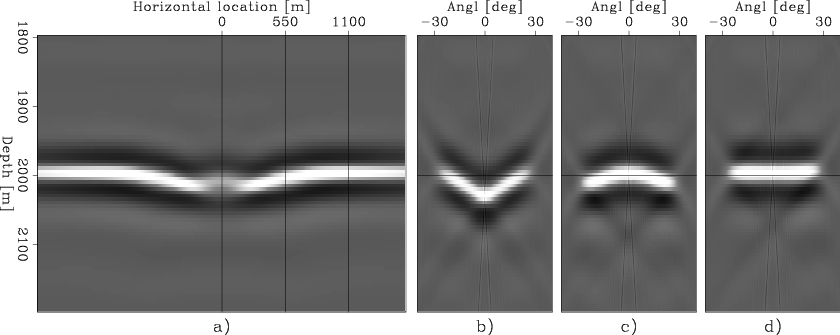
Figure 4 shows panels equivalent to the ones shown in Figure 3 after the data were drastically low passed before migration. The peak frequency of the data was reduced to 5 Hz, from the original 25 Hz of the full-bandwidth data. Because of the lower frequency, the wide angles in the ADCIG at .55 km (Figure 4c) do not suffer from cycle-skip problems. Consequently, the stack (Figure 4a) is now coherent over the majority of the reflector, except in the very central part approximately located between X=-.2 km and X=.2 km.
|
|---|
|
Mig-0-stack-X-overn
Figure 3. Angle-domain prestack image obtained from the full-bandwidth data set: (peak frequency at 25 Hz) a) stacked section, b) ADCIG at X=0 km, c) ADCIG at X=.55 km, and d) ADCIG at X=1.1 km. |
|
|
|
|---|
|
Mig-0-VLowFreq-stack-X-overn
Figure 4. Angle-domain prestack image obtained from the low-passed data set (peak frequency at 5 Hz): a) stacked section, b) ADCIG at X=0 km, c) ADCIG at X=.55 km, and d) ADCIG at X=1.1 km. |
|
|
|
|
|
|
Residual-moveout analysis in presence of strong lateral velocity anomalies |