|
|
|
|
Interpreter input for seismic image segmentation |
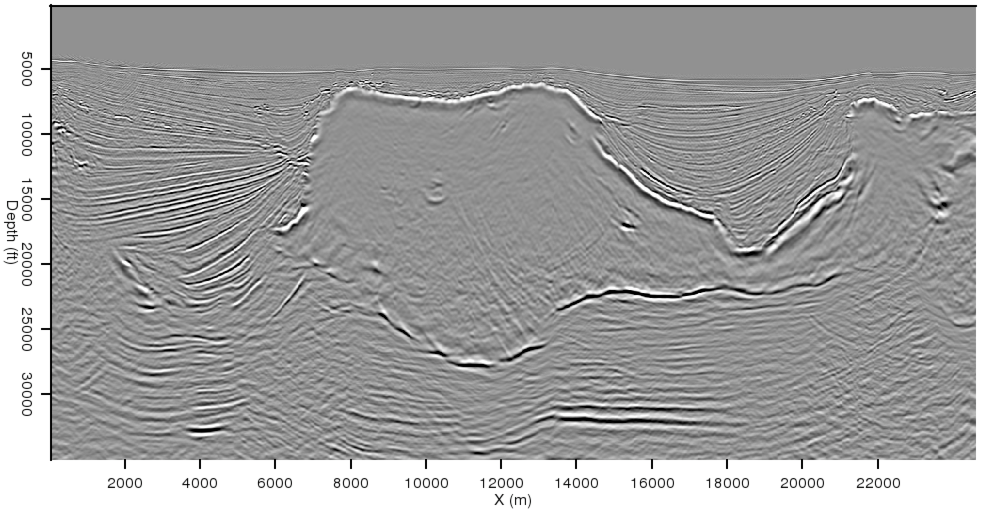
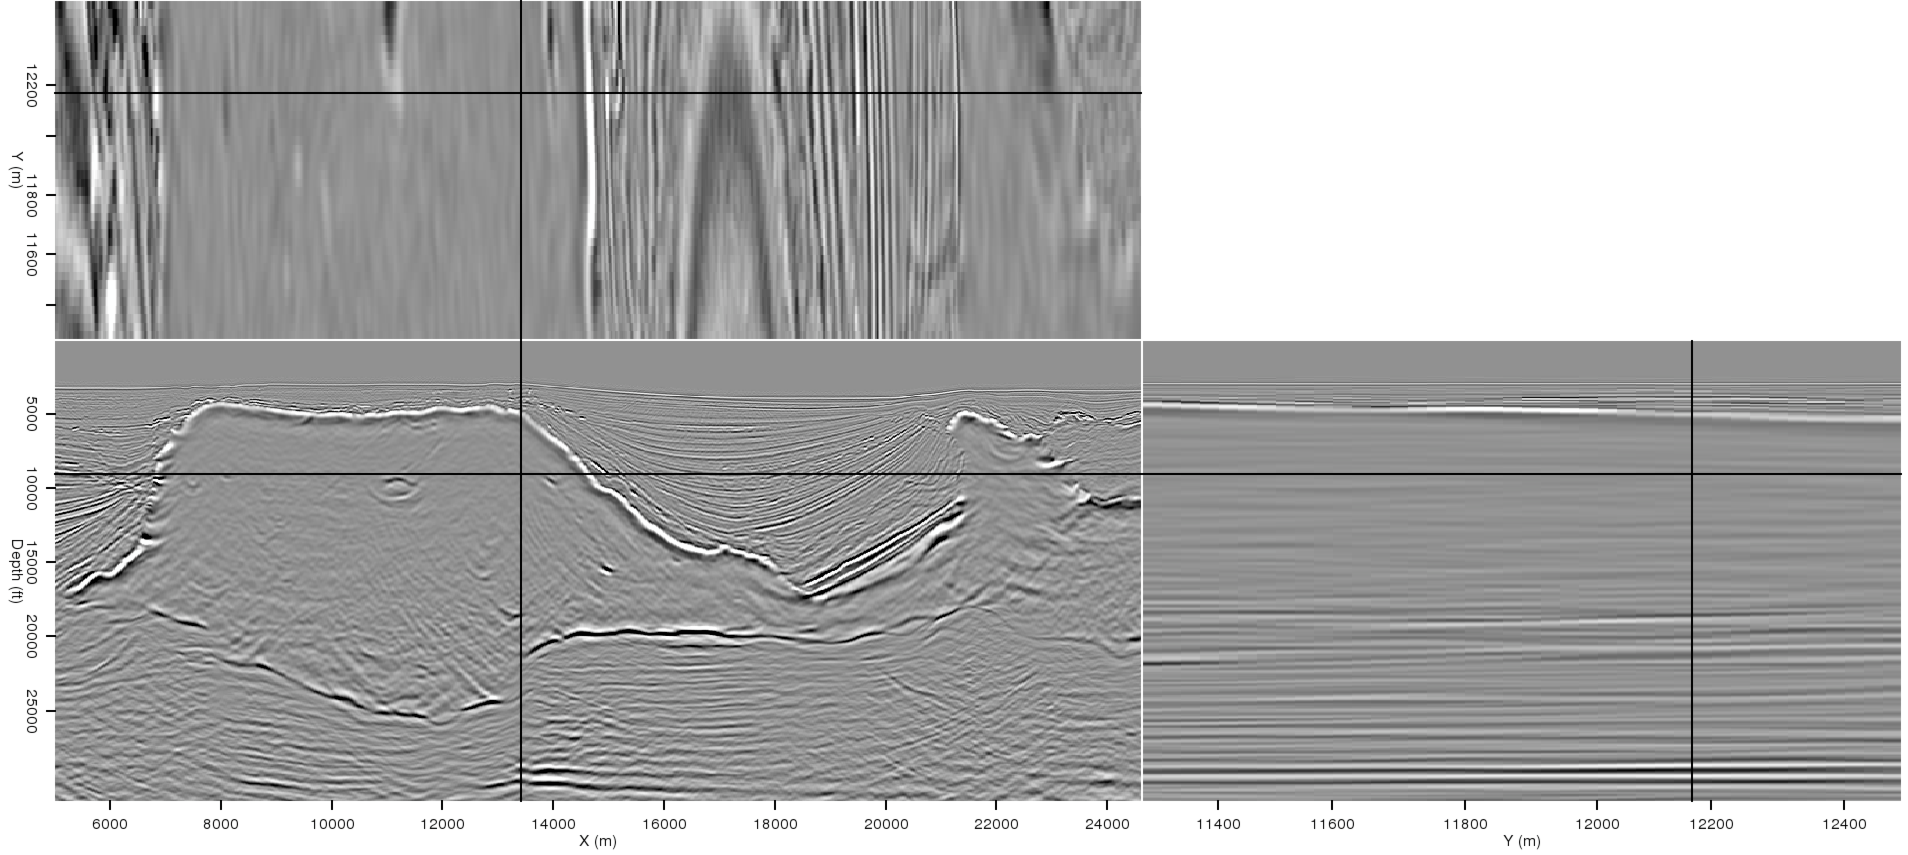
Beyond relatively simple horizon auto-picking, which tends to get lost along chaotic or discontinuous boundaries, a variety of options exist for global image segmentation. One useful approach, developed by Lomask et al. (2007), uses the eigenvector-based Normalized Cuts Image Segmentation (NCIS) method (Shi and Malik, 2000). However, this method is relatively inefficient; large seismic images require substantial preprocessing, and the computational domain must be windowed around a prior best-guess of the boundary to make the method computationally feasible. More recent work (Halpert et al., 2010) adopts a ``Pairwise Region Comparison'' (PRC) approach based on the method of Felzenszwalb and Huttenlocher (2004). This method holds several advantages over the NCIS approach, including computational efficiency and the ability to operate on full seismic images. In this paper, the PRC method is used as a basis to explore how an interpreter's own top- or base-salt picks can influence automated segmentation results in two or three dimensions. Throughout the paper, I show 2D (Figure 1(a)) and 3D (Figure 1(b)) field data examples from a wide-azimuth Gulf of Mexico dataset provided by WesternGeco.
|
|---|
|
oct-2d,oct-3d
Figure 1. (a) 2D and (b) 3D images taken from a field dataset that will be used for examples throughout this paper. |
|
|
|
|
|
|
Interpreter input for seismic image segmentation |